What a day! Yesterday I spent about seven hours downtown taking two exams: the RAC beta exam in the morning and the Oracle on Linux beta exam in the afternoon. The Linux exam was pretty easy for me but the RAC one had a lot of questions that made me think… and there wasn’t much time for that with so many questions being stuffed into the allowed time. I was planning on finishing this post last night but a friend called me just as I was starting… and I ended up helping move some furniture instead. But now I’m finally done and so I’ll take a stab at finishing up that case study.
We started with an overview of the environment and configuration. Then we framed the problem and started the investigation with a cursory look at some very course, high-level statistics from an AWR report on a 12-hour period. A few things that jumped out were a very poor parse cpu/elapsed ratio and high average wait times for shared pool and library cache latches.
A Closer Look at the AWR Report
Before I go too much deeper into this I would like to make a disclaimer: I’m pretty sure that I did unearth at least one thing that was affecting performance pretty dramatically… however by no means do I believe that I’ve found it all. There might be some additional tuning opportunities that I didn’t spot while gathering this data.
Now back to the story… as I pointed out yesterday, I don’t think you can really get to the bottom of this from just the AWR report. In fact it’s probably not even worth spending more than about 10 minutes on a report this broad. But I would like to point out three quick things that caught my eye before moving on. First off, it’s always worth having a look at the top SQL.
Now I don’t have a lot to say here besides that it concerned me a bit that the top two statements for elapsed appear to be recursive SQL (which should usually go quite fast). In fact the second one was executed 11 times and averaged 40 seconds per run!! If that’s being triggered by a parse statement then imagine how long the parse must have taken! The statement that seems to have used the most resources during this 12 hour period is reading the enabled constraints from the dictionary. One person commented on Wednesday’s post that the numbers don’t seem to be consistent in that the system doesn’t query them much but works very hard when it does query them. It does seem to be causing a lot of physical I/O – which may help explain the high elapsed time… but I’m still not sure about it.
Secondly, that sortof leads into having a glance at the latencies for I/O. They do seem a bit high – many datafiles are up around 20ms – but the SYSTEM tablespace (which is servicing both of the longest-waiting SQL statements) has a healthy-enough average read time of 4.42 ms.
Average… ugh.
Latches
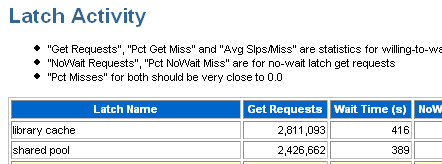
We could get better information by drilling down into shorter intervals for the AWR report or focusing on specific sessions with SQL trace. But what about those latch waits? This is what stood out to me the most.

I’ve just copied the two rows and columns that I noticed. Now I’m not quite brilliant enough yet that I instantly know good and bad values for these numbers but after comparing to a few other reports they seem to be a bit off. I’ve seen other systems acquire these latches far, far more times with the same or less elapsed time. Why are these latches taking so long?
So where did this leave me? Well things don’t look quite right in the AWR report… but I don’t see any solid leads. Our experience was that there wasn’t really one activity that performed poorly but rather the whole system. One other thing was that we consistently noticed that queries almost always went faster the second time. So my next step in this case was actually to broaden my investigation.
Broadening the Search
I had mentioned before that there are about 10 databases running on the system. So we had a look at a few more – and they were slow too. Well that means there’s a good chance of something going on system-wide. And at that level there are really three main things to look at: I/O, CPU and memory.
I read a great quote from Tanel Poder’s blog recently… I think I’ll call it Tanil’s dictum: “lower-level instrumentation always has a better chance to know what’s really going on at the upper level than vice versa.”
 Remember that the system has 3 CPUs, 16G of memory, and two I/O channels to the Symmetrix. And there are 10 databases running on it. The CPU load wasn’t bad and the Symmetrix seemed to be handling the I/O load very well. But how much memory is used by 10 databases? We added up all the SGA’s and got around 9G. What are the PGA settings? Most of the databases have targets around 1G however they’re not really using all of it. Any other programs on the server? A few process schedulers for PeopleSoft (one for each database). This was about when the light clicked on.
Memory
The moment I started looking at the memory utilization on AIX, I started seeing suspicious figures. The very first thing we noticed was that there was a lot of swap space and it was getting used pretty heavily:
$ lsps -a
Page Space      Physical Volume   Volume Group    Size %Used
paging02        hdiskpower3       psdev02vg     5120MB    43
paging02        hdiskpower4       psdev02vg     3072MB    43
paging01        hdisk0            rootvg        8192MB    58
paging00        hdisk0            rootvg        8192MB    58
hd6             hdisk0            rootvg        8192MB    58
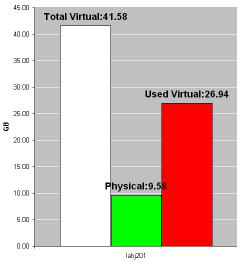
Not only that – but notice where the swap space is… 24G is on that VERY SLOW internal system disk! At this point we started watching the swap statistics closer in topas and vmstat. And invariably, anytime the system slowed down we saw heavy swap activity and the disk utilization for the local disks peg at 100%.
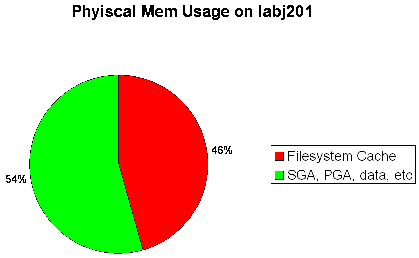
But that’s not all. Remember from the first post that all of the datafiles were stored on JFS2 filesystems? Well it didn’t take long to realize that CIO was not configured on this system and the JFS2 filesystem cache was HUGE – almost half of the physical memory on the box.
$ vmstat -vs
...
              4456448 memory pages
              4264254 lruable pages
                18850 free pages
...
                 20.0 minperm percentage
                 80.0 maxperm percentage
                 45.4 numperm percentage
              1939468 file pages
...
                 45.6 numclient percentage
                 80.0 maxclient percentage
              1945775 client pages


AIX has rather aggressive default targets for the JFS2 cache and although Oracle manuals state that you should reduce these it had never been done on this system. So after putting these two bits of information together we were able to paint this rather depressing picture of the memory usage on the system.
That Explains It
This probably explains why a lot of the numbers in the AWR report didn’t quite make sense; it seems likely to me that processes were sometimes spending a lot of time waiting for memory to be paged in. Because of the excessive and unpredictable paging it’s really impossible to quantify meaningful time-based metrics from within the database kernel.
We also pointed out that a core assumption in Oracle’s memory management algorithms is that the DB block buffer cache is in physical memory – closer to the CPU than the physical disks. By allowing this memory to page out to storage that’s actually slower than the disks where the data itself resides they not only undermined these algorithms but also made the database slower than it would be with no cache at all!
Not to mention that the system was double-buffering most data blocks and essentially wasting half of the physical memory on the system. In the end we made three top-priority recommendations: (1) configure CIO, (2) decrease the AIX filesystem cache size, and (3) pin the SGAs in memory. And only after that… tune the database. :)


The engagement started off as “health check”.
Did you start going into AWR strictly because your first SQL session indicated that something was very wrong with performance ?
Your findings to date are server level — although you have gone “from the inside out”, I guess most DBAs would have started with server side statistics first.
I think it was that first SQL session that made you dig into the database performance views first ?
Hemant
LikeLike
Posted by Hemant | July 3, 2007, 8:08 amHi sir,
Firstly I just discovered your site and blog and must say that its realy a very nice collection of extremely useful articles.I am going to add it in my bloglines and my favorite lists of blogs.
Sir,I am going to start prepairing for Orale on Linux exam.I have the book from Oracle Edu of it.What other reference material should I study before takingup the exam?How the structure of the exam is focussed?I am not asking about the questions but the strategy that you would suggest for one who is going to prepare for this exam?
Thanks and best regards
Aman….
LikeLike
Posted by Aman.... | July 9, 2007, 2:45 amHemant –
Sorry for the slow response – I was on vacation much of last week. :) The reason for not going to the OS first was that it was not in the initial scope of the engagement. I had about three days to review something like 15 peoplesoft databases plus looking into a few specific slow-running queries. So there wasn’t really time for the usual in-depth, thorough review. The plan was to focus on application-level issues until I realized that there were serious low-level configuration problems.
Aman –
I can’t say too much about the test; but I think that the topic list they posted is a good starting point. Like I said I think that if you’re pretty familiar with Linux then I don’t think it should be too difficult. Also, it’s all multiple choice so good test-taking skills will benefit you a lot; for example, sometimes the phrasing of one question can give you clues about the answer to another question if you pay close attention.
Good luck!
LikeLike
Posted by Jeremy | July 12, 2007, 9:27 am