It was 5:17pm today, just as I was wrapping up work for the day, and my manager pinged me with the following chat:
<manager>: Hi Jeremy - we have a <other team> ticket - escalated to <leader>, <leader>, etc. <principal> is on trying to advise as well. Are you available this evening if needed for diagnostics? <coworker> is on the call now
No obligation; just checking in to see what my availability is. Quickly thinking it over – I didn’t have any plans tonight, nothing in particular on my agenda. Why not? If I can help then someone else on the team won’t have to, and I don’t have anything better to do tonight.
<Jeremy>: yes
<Jeremy>: i'm free and available all evening
I synced up with my coworker and then joined the bridge line where the front line tech team was troubleshooting.
Last week I was chatting with a few software engineers who I work with, and I remember sharing my opinion that the most interesting problems are not obvious ones likes crashes. In the grand scheme of things, crashes (usually generating a core dump) are rather easy to debug. The truly sinister problems are more like vague brown-outs. They never trigger your health monitoring or alarming. All your synthetic user transactions work. There are no errors in the logs. But one particular function or module of your application that usually completes in a few seconds suddenly starts taking 10 minutes to finish. This might be caused by, perhaps, a single SQL query that suddenly and inexplicably starts taking longer to complete. Whenever you run the SQL yourself, it completes in seconds. Yet you can see the pile-up of database connections, and unrelated parts of the application start experiencing delays acquiring new connections themselves… and nothing quite fails all the way, yet something isn’t working for your end users. An ominous backlog starts building up in some work queue which threatens much bigger problems if it’s not dealt with soon. You see the freight train coming straight towards you…. tortuously slow and unavoidable.
This was similar to the situation I walked into today. The tech team that I met uses PostgreSQL as a data store in one part of their application architecture. They have many deployments of this application around the world. This morning, in one geography, they performed a major version upgrade of a PostgreSQL database to version 11. After the upgrade, one part of the application started experiencing problems.
By the time I joined the call, the team was already several hours deep in the investigation. They knew which part of the application was impacted. They knew that one specific SQL executed by this module was having problems. There was a “throttle” that could be used to slow down or pause this particular application module, so they temporarily turned off the module to prevent adverse impact to the database – except when we were actively troubleshooting. When the module was enabled, the PostgreSQL view pg_stat_activity showed that hundreds of connections would concurrently run this SQL. There were no wait events evident in the view, which meant that the SQL was active on the CPU. The system CPU utilization spiked to around 100% so it was pretty obvious this wasn’t a matter of some un-instrumented off-CPU wait.
The query itself was actually rather simple – with one little gotcha: a dynamic in-list containing between one and a thousand elements. Pretty common pattern. It’s fun because it prevents both computers and humans from easily grouping together related queries. For example, the pg_stat_statements view will have several hundred different entries, each with a different number of in-list elements. But the query operated on a single table and only had one filter in addition to the in-list (a '<=' operator).
Here’s a rough outline:
SELECT *
FROM table
WHERE (text_col1, numeric_col3) IN (('first1',1),('second1',2), ... )
  AND timestamp_col1 <= :1
That’s all! Simple! According to pg_relation_size() the table was 845GB. Two indexes exist which are relevant for the query at hand: a 229GB btree “index1” on (text_col1, text_col2) and a 206GB btree “index2” on (numeric_col1, numeric_col2, numeric_col3, timestamp_col1). It’s important to note that the final two columns in this second index are referenced in the query.
The most obvious theory was a bad execution plan coming from the planner. This is expected with major version upgrades of any relational database. Major versions are when you get all the tweaks and improvements to the planner, optimizer, costing algorithms, etc. Most of your queries either stay the same or get faster. But naturally, there might be a regression or two. And it only takes one to ruin your weeknight….
Nonetheless, when we executed the query from psql it returned in a few milliseconds – the good performance we expected. We also connected to another deployment in a different geography (still using the older major version of PostgreSQL) and verified the same execution time and execution plan. As I joined the call, the theory was being proposed that the application used prepared statements and perhaps after the upgrade the application had connected and cached its prepared statements with bad plans before updated statistics were ready.
Side note: I’m sure all the brilliant readers of this article already know that in PostgreSQL, object statistics are reset with major version upgrades! You need to run ANALYZE to update your statistics after starting the new major version!
Accordingly, the team was just about to start a rolling restart of the application server fleet in the geography with the recently upgraded database. They verified that the database had up-to-date statistics and they wanted to be sure that the application servers would get fresh database connections with the best possible execution plans.
I listened closely, but I was aware that there wasn’t much evidence this would fix the issue (although it was a very good guess). In the meantime, I kept reading the ticket history and cross-checking the work that had been done around testing executions plans.
Unlike some other relational databases, PostgreSQL does not give much visibility into execution plans used at runtime. There’s auto_explain which can log actual plans for SQL that successfully completes with a runtime above some threshold. The pg_stat_activity view added query_id in PostgreSQL 14, and I’m hopeful that a plan_id might come someday – but the work hasn’t been done yet. With a plan hash in both pg_stat_activity and in the EXPLAIN output, it would be trivial to know whether the query that your app server is currently executing has the same plan as the query you just ran in psql – even with low latency, high frequency queries that you couldn’t log due to volume. Of course dynamic in-lists might still throw a wrench into this, but I don’t know of any relational databases that have a great solution for that yet.
(Edit 10-Feb-2022: Joshua left a comment reminding me about Cybertec and Hironobu Suzuki’s extension pg_show_plans. It was an oversight not to mention it when I first wrote this article and I’m glad Joshua mentioned it. I’d seen the extension before but hadn’t yet had a chance to install this and try it out. You can be sure that it’s now a priority to take a closer look!)
The next best solution I know is using pg_stat_statements as a proxy of sorts. I asked a DBA on the team to run the following query:
select substr(query,1,40),calls,total_time,mean_time,stddev_time,(shared_blks_hit+shared_blks_read)/calls blks,rows from pg_stat_statements where query like '%(text_col1, numeric_col3)%' order by total_time desc;
And here’s what came back:
            substr       | calls |    total_time    |    mean_time     |   stddev_time    | blks | rows
-------------------------+-------+------------------+------------------+------------------+------+------
 select * from table whe |    57 |     21904.791707 | 384.294591350877 | 759.553887634356 | 2444 |   24
 select * from table whe |  2383 |     20875.809368 | 8.76030607133866 |  39.355973386603 | 2610 |   10
 select * from table whe |    98 |     14309.699707 |  146.01734394898 | 396.703422675129 | 1846 |   10
 select * from table whe |    78 |     14282.730893 | 183.111934525641 |  430.76318896177 | 1769 |   43
 select * from table whe |    41 |     14053.415115 | 342.766222317073 | 848.723086074263 | 2893 |   28
 select * from table whe |   106 |     12767.352093 | 120.446717858491 | 293.357452072648 | 1756 |   24
 select * from table whe |    51 |     12442.307684 | 243.966817333333 | 530.104152533396 | 2077 |   22
...
 explain analyze verbose |     1 |        23.031251 |        23.031251 |                0 |  241 |    0
 select * from table whe |     2 |        11.987225 |        5.9936125 |        0.7968815 |   46 |    2
 select * from table whe |     1 |         6.697005 |         6.697005 |                0 | 3026 |    1
 select * from table whe |     1 |         6.032849 |         6.032849 |                0 | 2704 |    0
(315 rows)
I asked them to run the same query in the other geography that was still running the older major version of PostgreSQL. Naturally, the other geography showed a much higher call count – because this query is showing cumulative totals since the last database restart, and of course the problem database was restarted as part of the upgrade.
The first thing I noticed was that the ratio of rows to blocks between the two regions was radically different – the good geography had a lot more rows. Could that mean a different execution plan was being used? Then I realized that I’d just made a mistake in interpreting the my own query; I was reporting “blocks per call” but I was reporting “total rows for all calls”. After I figured that out, I realized that the numbers between the good and bad geographies actually didn’t seem remarkably different. The same was true for the execution plans and the execution time when we ran the problem queries at a psql prompt – they were the same “good” values in both the good and bad geographies.
Here’s the healthy and fast execution plan we were seeing:
 Bitmap Heap Scan on table  (cost=3791.09..80234213.68 rows=6713 width=273) (actual time=74.911..74.953 rows=0 loops=1)
   Output: <all columns>
   Recheck Cond: (((text_col1)::text = 'first1'::text) OR ... OR ((text_col1)::text = 'second1'::text))
   Filter: ((timestamp_col1 <= '2022-02-09 00:00:00'::timestamp without time zone) AND ((((text_col1)::text = 'first1'::text) AND ... AND (numeric_col3 = '2'::numeric))))
   ->  BitmapOr  (cost=3791.09..3791.09 rows=212565 width=0) (actual time=74.905..74.946 rows=0 loops=1)
         ->  Bitmap Index Scan on index1  (cost=0.00..38.65 rows=2261 width=0) (actual time=0.026..0.026 rows=0 loops=1)
               Index Cond: ((text_col1)::text = 'first1'::text)
         ->  Bitmap Index Scan on index1  (cost=0.00..38.65 rows=2261 width=0) (actual time=0.446..0.446 rows=0 loops=1)
               Index Cond: ((text_col1)::text = 'second1'::text)
         ->  Bitmap Index Scan on index1  (cost=0.00..38.65 rows=2261 width=0) (actual time=0.447..0.447 rows=0 loops=1)
               Index Cond: ((text_col1)::text = 'third1'::text)
Listening on the call, I heard someone mention that queries were timing out due to a statement_timeout setting around 2 minutes. This led to some question about whether the pg_stat_statements data simply didn’t reflect the long-running queries because they were erroring out. I think this actually was the case. But it led to another idea – I asked if someone who had access to the PostgreSQL log file could calculate the rate at which they were seeing timeout errors. (Errors are the common ‘E’ of both the USE method and the RED method! Something to watch closely!) This gave further confirmation that the issue started with the upgrade and didn’t exist in the other region, but not a lot else.
At this point, I started to feel a little worried. If it wasn’t a plan change, then what could it be? Hardware problem like a defective CPU running at an incorrect frequency? (Seen that before.) Some hard-to-find bug deep in the bowels of the Linux kernel? (Seen those too and I don’t like them.) My teammate had already done a quick-and-dirty run of perf and grabbed a screenshot, but I decided to up the ante. We have a script of our own which is very similar to Tanel Poder’s run_xcpu.sh in his 0x.tools collection. It uses perf to perform low-frequency, conservative sampling of stacks from running processes. It runs continually in the background, retains data for one week, and can be left safely running for months. Even on a heavily loaded server with dozens and dozens of cores, it won’t overwhelm the system with too many files or too many bytes. Like Tanel’s script, it’s designed to be safely used in production. We flipped the switch and started profiling the CPU with the database at 100% CPU.
After about 10 minutes, I generated a flame graph. Here’s what we saw:
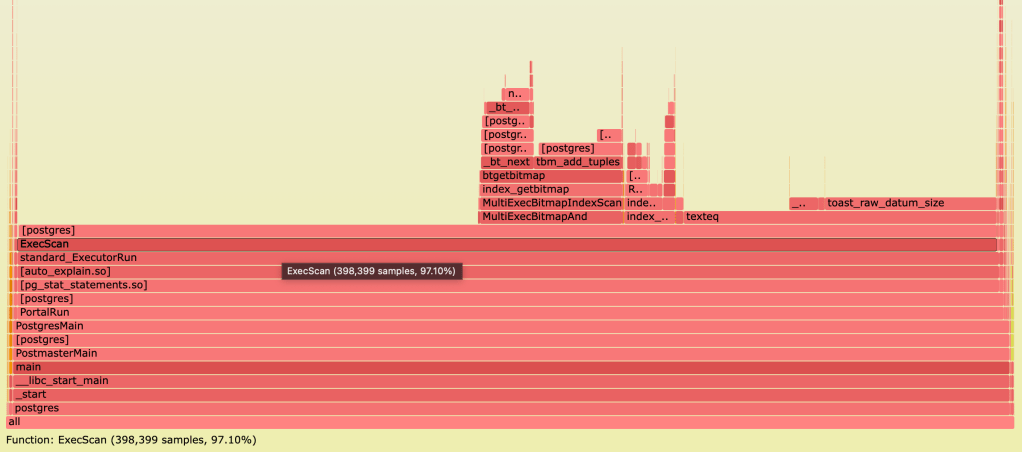
When I first looked at the CPU profile on the bad system, I didn’t think it would help much. The call stack basically matches the execution plan we saw above, which was performing well in our tests! Executor_Run is calling ExecScan (corresponds to “Bitmap Heap Scan”) which in turn is calling the BitmapIndexScan. I knew that the classic index scan and seqscan were slow (tested with session GUCs), but it really didn’t look like either of those was happening here. It’s clearly doing the bitmap scan. This is only confirming my fears that our problem is not a bad plan.
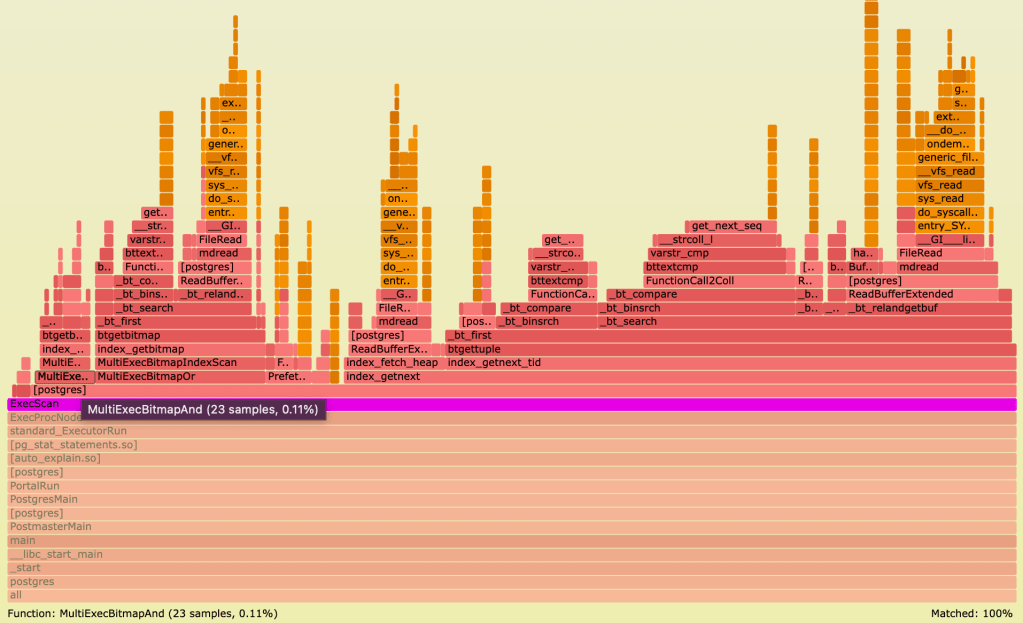
For comparison, I used the same script and generated a flame graph for the older PostgreSQL database in the good geography. I highlighted occurrences of the ExecScan function. Here’s what that looked like:

The first thing to notice here is the sample count. Remember that both of these were gathering samples at the same frequencies for about the same duration (10 minutes) – so the difference in sample count actually reflects a difference in CPU time. Everything we see on the healthy system probably still exists somewhere on the unhealthy system…. but it’s so tiny you can’t see it, because it’s just a few data points compared with 400 thousand data points coming from one bad query that’s killing the CPU.
Now I thought to myself, this problem query must be running somewhere on the healthy system. The call stack might have tiny differences on the older major version of PostgreSQL – but I bet it’s going to be roughly the same. I started with those ExecScan nodes and looked at the ones that appeared lowest in the stack. It didn’t take me long to find it – it’s the only one that’s not preceded by some kind of sort or loop:

When I zoomed in on this node, I noticed something that I didn’t quite understand. It looked almost identical to my unhealthy system – and I was pretty confident that my query was in there – yet there was a bit more. I saw the function MultiExecBitmapAnd but only with a mere 23 samples. And there was this function MultiExecBitmapOr alongside with 63 samples. A similar execution plan that is very close to the one which is causing problems.
Now I’m a big fan of the Oak Table Network, one reason being their dogged advocacy for taking an evidence-based, scientific and methodical approach to database problem solving. (You’d be shocked how common the approach is of “find whoever sounds the smartest/loudest and let them make guesses until the problem goes away…”) But frankly, while I will squeeze every last drop out of the methodical approach, with tricky problems the diagnostics data is often unavailable which you’d need for deductively following one step to the next until the solution is evident. This seemed like one of those situations. I took off my headset and stepped away from the desk. Walked a little and tried to think outside the box.
I was thinking, “I wonder if these are related?” I did a search on the bad flame graph for MultiExecBitmapOr – lo and behold it was there – with a mere 366 samples, a tiny invisible sliver next to the bad SQL. It was around this time when I re-visited the execution plan for the good SQL statement and I noticed something important: there was a plan node called “BitmapOr”. As I looked at the flamegraphs from both systems, the idea is becoming more plausable: “I wonder if this good SQL plan actually corresponds with the stacks I’m seeing on the healthy system? and if this good SQL plan is NOT the plan that’s killing the CPU?”
It was time to learn something new about PostgreSQL! What is the exact difference between “BitmapOr” and “BitmapAnd” and why is the latter murdering my CPU?! I started with a search of the PostgreSQL documentation, which turned up one or two hits but nothing especially useful. Next I tried google, which led me to a little blurb on the PgMustard site. My confidence was growing that my CPU profile might be a smoking gun for a bad plan. Finally I jumped over to GitHub and did a quick search of the PostgreSQL code base. Skimmed over some comments and code hits. I’m confident now that the call stack on the flame graph from the bad database reflects a different plan than what we’re getting when we run the query ourselves.
Then I had a “hunch”.
The query had an in-list with a bunch of OR conditions. But it also had one other filter – joined by an AND condition: the timestamp. I thought that just maybe if the planner expected lower cardinality out of that date filter, it might try to pull that data from an index and build a bitmap and change my execution plan. I tried re-running the query, simply changing the year from 2022 to 2021.
The query … did … not … return. I waited ten seconds… 30 seconds… 1 minute. Trying not to sound excited or anything, I made a casual off-hand comment on the bridge line that I’d changed the date and my query was still running.
After hours of troubleshooting this production brown-out situation, we might have finally reproduced a culprit bad execution plan. After a few minutes the query was still running. I had reflexively typed EXPLAIN ANALYZE and I was waiting for it to complete so that I could post the plan to the ticket. My manager pointed out that I could just run EXPLAIN and get the plan right away. OF COURSE WHY DIDN’T I THINK OF THAT! (Don’t look at me like that. I know you forget obvious stuff sometimes too.)
A few seconds later:
 Bitmap Heap Scan on table  (cost=50887511.91..3195672174.06 rows=73035 width=24)
   Recheck Cond: ((((text_col1)::text = 'first1'::text) OR ...
     ...OR ((text_col1)::text = 'second1'::text)) AND (timestamp_col1 <= '2021-02-09 00:00:00'::timestamp without time zone))
   Filter: ((((text_col1)::text = 'first1'::text) AND (numeric_col3 = '1'::numeric)) OR ...
    ...OR (((text_col1)::text = 'second1'::text) AND (numeric_col3 = '2'::numeric)))
   ->  BitmapAnd  (cost=50887511.91..50887511.91 rows=418910 width=0)
         ->  BitmapOr  (cost=13320.96..13320.96 rows=513729 width=0)
               ->  Bitmap Index Scan on index1  (cost=0.00..36.56 rows=2114 width=0)
                     Index Cond: ((text_col1)::text = 'first1'::text)
               ->  Bitmap Index Scan on index1  (cost=0.00..36.56 rows=2114 width=0)
                     Index Cond: ((text_col1)::text = 'second1'::text)
               ->  Bitmap Index Scan on index1  (cost=0.00..36.56 rows=2114 width=0)
                     Index Cond: ((text_col1)::text = 'third1'::text)
         ->  Bitmap Index Scan on index2  (cost=0.00..50874172.44 rows=2597695782 width=0)
               Index Cond: (timestamp_col1 <= '2021-02-09 00:00:00'::timestamp without time zone)
(493 rows)
Do I see a BitmapAnd plan node? Do I? I’ve never been so happy to see a BitmapAnd execution node! The fact that my query never completed, combined with this execution plan and the CPU profile – in my opinion we now had conclusive evidence for the problem’s root cause.
First: PostgreSQL, my dear, my lovely relational friend, WHAT ARE YOU THINKING?! This is a 206GB index on four columns, of which only the third and fourth are in our SQL. This is not a point select or even a range select. You must scan all 206GB of memory to build this bitmap – containing just a few entries. WHY would you do this to me?
BUT.
More importantly: We don’t yet have a fix. We’re still down. So… back to work.
Sadly, the options in PostgreSQL are very limited. This particular database does not have pg_hint_plan. I’m a little leery about mixing session-level SET statements and connection pools. There’s a trick I like where you wrap a SQL in a SQL (not PL/pgSQL) function and use SET attributes on the function definition – but I’m unsure about the overhead of PL/pgSQL for this specific situation and we can’t handle the dynamic in-list without it. Anyway it doesn’t matter because PostgreSQL doesn’t have a GUC that can disable only BitmapAnd while leaving BitmapOr – so none of these options help anyway.
Increase statistics_target? Realistically, that’s unlikely to help. Drop an index or change indexing strategy? The biggest problem with all these approaches is blast radius: we’re in a production down situation with a big dev team and a fleet of application servers and a complex software stack and the last thing we need to do as break 10 other random queries while trying to fix this one. For emergency situations, we need localized solutions.
The options for this specific situation are… nonexistent. Or, wait, are they?
So I quickly borrow a page from 1990’s PostgreSQL Hacker School. To be clear, I didn’t go to this school. I watched a video about it on YouTube last week. Actually I just copied the solution from StackExchange. The hack is to use a Common Table Expression (CTE) as an optimization barrier. Total hack. Beautiful hack. Note that in pg 14+ these can be folded into subqueries so you’ll need to explicitly materialize them. A quick test confirms that this works: if we move the date filter outside of a CTE then PostgreSQL won’t try to combine that nasty index and make one big gloriously fatal bitmap operation.
(Edit 16-Feb-2022: Sayan Malakshinov reminded me last week on twitter about another old hack, which had slipped my mind on the day of the incident: replacing “col” with “col+0” (or the textual equivalent of appending an empty string). I’ll need to try this out in PostgreSQL; if it works then I’d prefer this over a CTE as I think it obscures the original SQL less.)
WITH subq AS (
  SELECT *
  FROM table
  WHERE (text_col1, text_col2) IN (('first1',1),('second1',2), ... )
)
SELECT * FROM subq
  WHERE timestamp_col1 <= :1


 CTE Scan on subq  (cost=3279343497.40..3279345512.66 rows=29856 width=178)
   Filter: (timestamp_col1 <= '2021-02-09 00:00:00'::timestamp without time zone)
   CTE subq
     ->  Bitmap Heap Scan on table  (cost=14325.28..3279343497.40 rows=89567 width=32)
           Recheck Cond: (((text_col1)::text = 'first1'::text) OR...
             ... OR ((text_col1)::text = 'second1'::text))
           Filter: ((((text_col1)::text = 'first1'::text) AND (numeric_col3 = '1'::numeric)) OR...
            ...OR (((text_col1)::text = 'second1'::text) AND (numeric_col3 = '2'::numeric)))
           ->  BitmapOr  (cost=14325.28..14325.28 rows=513729 width=0)
                 ->  Bitmap Index Scan on index1  (cost=0.00..36.56 rows=2114 width=0)
                       Index Cond: ((text_col1)::text = 'first1'::text)
                 ->  Bitmap Index Scan on index1  (cost=0.00..36.56 rows=2114 width=0)
                       Index Cond: ((text_col1)::text = 'second1'::text)
...
                 ->  Bitmap Index Scan on index1  (cost=0.00..36.56 rows=2114 width=0)
                       Index Cond: ((text_col1)::text = 'third1'::text)
(493 rows)
The application is a single code base that runs against all supported versions of PostgreSQL. (There won’t be multiple major versions for long; only until all deployments get upgraded to v11.) We do a sanity check of the rewritten query on the old major version. We’re pretty confident that this hack is a solid fix – so I look at the application source with the development team to make sure it’s possible to actually modify the dynamic SQL getting sent to the database. Turns out that this is a trivial change. After code reviews and approvals the update starts moving through pipelines and automated testing begins in lower environments. I mostly watch and wait while the conversation on the bridge turns to development teams coordinating a deployment targeted to this geography that is accelerated yet still careful. I start thinking to myself that this would make a good story. Maybe I should write an article for my blog.
I make myself a late dinner. After a couple hours watching pipelines turn green, and generally tuning out from the on-and-off chatter of devs on the bridge, the fateful moment arrives. The fleet of application servers is about to start executing the code path with the updated query.
Suddenly I feel very worried. A big team of people just spent a couple hours deploying code… all based on a dirty hack that I suggested with a couple basic tests. At this moment, I start thinking that I should have done a lot more testing. I don’t think I did nearly enough. What if there’s something I didn’t think of? If this doesn’t work then I’m going to feel very, very embarrassed for those hours of effort and coordination and approvals. On top of it all we’ll be back to square one having lost precious hours of time.
I’m watching pg_stat_activity and I’m hitting refresh like every 5 seconds. I see some active sessions on buffer_io waits. There’s some DataFileRead activity. I don’t really see anyone on CPU (active with no wait event). Still, we’re all a bit gun-shy and nobody wants to declare victory prematurely. We watch for 5 minutes. 10 minutes. One DBA on the bridge line says the database looks good to him. A developer is sharing her screen and jumping between various application level metrics – most frequently, a p99 for the module that we know was previously broken. We’re slowly starting to believe the dashboards.
Someone on the call says it. We’re going to watch for another 10 minutes and if things look good, then we can drop off the line. I feel pretty good that a 90’s hack saved us from certain doom. I wish we’d had more options, but all-said-and-done we got out relatively unscathed today. One of the dev managers expresses appreciation for everyone sticking with it. I ask him to drop a note to my manager saying thanks – it’s always good, when possible, to get little thank you notes in writing (directly to your manager) for your success stories.
Besides the fact that I only got lucky with a 90s hack today, there’s one other thing that scares me a little bit. I once said on twitter: IMO, one of the more compelling arguments for NoSQL is exactly this: you will have a “prod down” outage and someone’ll need to understand this to fix it. Hints are a top tool. But skills shortage is the bigger problem. One perspective is that the most potent application of NoSQL is as a business or organizational tool, and the technical angle is secondary. Large distributed NoSQL systems are arguably *more* complicated to troubleshoot than monoliths. (Unpopular opinion?) You can’t gdb the network, sister. You replace “gdb backtrace” with a second cluster of computers running Honeycomb, and hire another team to debug the servers you need to debug prod. The complexity is moving up the stack and increasing. And to be clear: someone else managing the complexity doesn’t mean it’s unimportant. The problem with relational databases might be in a comparison with various illegal substances… it’s just so easy to get hooked and before you know it you’re way over your head. Here’s the thing: nobody is going to build a massive complex distributed system on *accident*. (Except maybe Bryan Cantrill. I only say that because he’s really smart.) But people write these little innocent-looking SQL statements in just minutes… which do in-memory bitmap joins of indexes, use bloom filters, perform index-only table bypass, walk through 10 data sources in an optimal order, dynamically choose between looping over indexes or bulk scanning data based on statistical analysis of the expected amounted of data being accessed. Not to mention keeping data clean with transactions and defined constraints, so your 23-year-old recently graduated data scientist can actually do business statistics instead of spending his first 11 months cleaning up data. People write these innocent short SQL statements EVERY DAY. And they have NO IDEA the frightening power of the universe that’s emanating from their fingertips. A shocking majority of the time, everything Just Works. But people can’t stop themselves and they build bigger and bigger and problems occasionally arise. Then people may feel overwhelmed trying to troubleshoot. And I truly feel conflicted sometimes about whether it’s responsible to allow people to go on like this – I think that’s a fair debate.
One thing I will say: if you’re interested in relational databases, there are jobs! 🙂
So here we are. I didn’t originally intend to stay up late writing this, but I thought that maybe there’s a lot to learn from stories like this. Oooooh… or even better… maybe someone who knows C better than me will read this and add plan_id to pg_stat_activity! I WILL BE INDEBTED TO YOU FOR LIFE. Seriously. (Edit: as noted above, I also plan to look a bit more into the extension pg_show_plans.)
But either way, I’ll be hanging around PostgreSQL. I like it.
Postscript: Of course, I’ve changed the names of objects to protect the innocent. I tried to preserve data types and statistics. But I could have made mistakes while revising the article… let me know if anything looks off!


Sounds like a couple troubleshooting sessions i’ve had over the years for similar reasons. Generally solved the same way, by decomposing the query a bit and forcing the planner to act a different way.
I wish Postgres naturally gravitated towards plans that had fewer performance cliffs even if on average queries take slightly longer.
LikeLiked by 2 people
Posted by Adam Brusselback | February 10, 2022, 6:43 am“Unlike some other relational databases, PostgreSQL does not give much visibility into execution plans used at runtime.” Do you think this module would be useful in your situation? I have used it successfully to debug query plans of queries that take a long time to run. It helped because I could start the query, look at the execution plan, and if I found that it was a terrible plan I could kill the query before it took up too much of my time. https://github.com/cybertec-postgresql/pg_show_plans
LikeLiked by 1 person
Posted by JoshuaPK | February 10, 2022, 1:11 pmThanks for this! It was an oversight not to mention that extension and I’ve added a note above.
LikeLike
Posted by Jeremy | February 10, 2022, 5:15 pmWonderful read Jeremy! Thanks for sharing, lots of learnings coming out from your interesting and elaborate write-up. The beauty is that you didnt just put down the cause and fix/workaround, it felt as if I spent some of those moments with you while you were thinking and going about it! You’ve laid down the thought process. Thanks!
Given postgres’s limited diagnostics, I have tried my hands at perf (and flame) but could not make much sense out of it. Is there a link or some material that can help me master it? Thanks
LikeLiked by 1 person
Posted by Purav Chovatia | February 10, 2022, 7:58 pmVery very interesting write up. Great story telling as well
LikeLiked by 1 person
Posted by Moulick Aggarwal | February 10, 2022, 8:58 pmTo avoid the issue of queries with IN() polluting your pg stat statements, you can in most of the case replace your
WHERE a IN()
With
WHERE a = ANY()
No matter the number of options in the ANY operator, it’ll hash to the same query id.
Semantics between ANY and IN are very slightly different, but 95% of the case it’ll get the job done and give you better stats (by having all queries analyzed together).
LikeLiked by 1 person
Posted by neamar | February 10, 2022, 11:56 pmARRAY[‘test’::text] <@ myarray
is almost always faster than
‘a’ IN myarray
as well. ANY is probably an easier swap to try first since you are using tuples. You’d probably want to test the different approaches to see which performs best with your data and indexes. Generally whenever I see someone using
INit raises a little code-review flag in my head.LikeLike
Posted by Rick Otten | March 1, 2022, 8:55 amWould be cool, if you could share the scripts that sample the processes and generate those flame graphs
LikeLiked by 1 person
Posted by Hans C. | February 11, 2022, 12:05 amBrendan Gregg is a huge advocate of flamegraphs: https://www.brendangregg.com/flamegraphs.html . If I ever need a flamegraph for a particular system, that’s where I start.
LikeLiked by 1 person
Posted by Joseph | February 11, 2022, 8:00 amThis reminds me of my course project from a database class. ui-optimizer-postgres [1]. It’s more of learning tool. It used gtk to allow you to modify the plan in real time. This was 6 years ago, so my memory is a fuzzy.
Write up: https://github.com/josephmate/ui-optimizer-postgres/blob/REL9_3_UI_OPTIMIZER/write-up/write-up.pdf
[1] https://github.com/josephmate/ui-optimizer-postgres/tree/REL9_3_UI_OPTIMIZER
PS: Definitely don’t use this in production because the DB blocks, waiting for someone to confirm the plan ;)
LikeLiked by 1 person
Posted by Joseph | February 11, 2022, 8:02 amVery interesting and vivid write-up, Jeremy. Thank you!
LikeLiked by 1 person
Posted by Geotti | February 12, 2022, 4:53 amSo much relatable, had a same story while upgrading MySQL.
I can’t forget even the date : 13-10-2019 😂😂😂
LikeLiked by 1 person
Posted by Jyoti | February 16, 2022, 5:58 am“People write these innocent short SQL statements EVERY DAY. And they have NO IDEA the frightening power of the universe that’s emanating from their fingertips. A shocking majority of the time, everything Just Works. But people can’t stop themselves and they build bigger and bigger and problems occasionally arise. Then people may feel overwhelmed trying to troubleshoot. And I truly feel conflicted sometimes about whether it’s responsible to allow people to go on like this – I think that’s a fair debate.”
I’m always reminded of what Edsger W. Dijkstra said about higher level languages (like C compared to assembler):
“People thought that those languages would solve the programming problem. But when you looked closely the trivial aspects of programming had been automated while the hard ones remained. The higher programming languages which was intended to make programming [easier] proved, coupled with the increasing ambitions of the applications, to be more intellectually demanding to the programmer.”
LikeLiked by 1 person
Posted by Lennie | February 16, 2022, 7:27 pmNew Postgresql version doesn’t count CTE as optimization barrier without modification.
From 12 release notes:
LikeLiked by 1 person
Posted by funny_falcon | February 18, 2022, 11:16 pmGreat writeup!
CTE’s didn’t exist in the 90’s ;P The really old-school optimization fence, which still works AND doesn’t require materializing into a TupleStore is to use OFFSET 0, ie:
SELECT * FROM
(
SELECT *
FROM table
WHERE (text_col1, text_col2) IN ((‘first1’,1),(‘second1’,2), … )
OFFSET 0
) subq
WHERE timestamp_col1 <= :1
In my experience, single-ended timestamp range queries (ie, timestamp > value) are a big red flag. Not only can you get really, really bad behavior if value gets too far away from
now(), you can also get bad plans if value is close tonow()but the planner stats are too far out of date, because the optimizer thinks there’s no data to be found.BTW, is it possible the <= in the example query should be >=? As written it’s looking for everything older than a specific time, which isn’t the pattern I normally see.
LikeLiked by 1 person
Posted by Jim Nasby | February 22, 2022, 3:52 pmBTW, is it possible the <= in the example query should be >=?
I also have this question, hope the author can confirm this later.
LikeLike
Posted by Jiacai Liu (@liujiacai) | February 23, 2022, 8:25 pm