Saw this post on LinkedIn yesterday:
I also somehow missed this setting for years. And it’s crazy timing, because it’s right after I published a blog about seeing the exact problem this solves. In my blog post I mentioned “unexpected behaviors (bugs?) in… Postgres itself.” Turns out Postgres already has the fix; it’s just disabled by default.
It was a one-line change to add the setting to my test suite and verify the impact. As a reminder, here’s the original problematic behavior which I just now reproduced again:
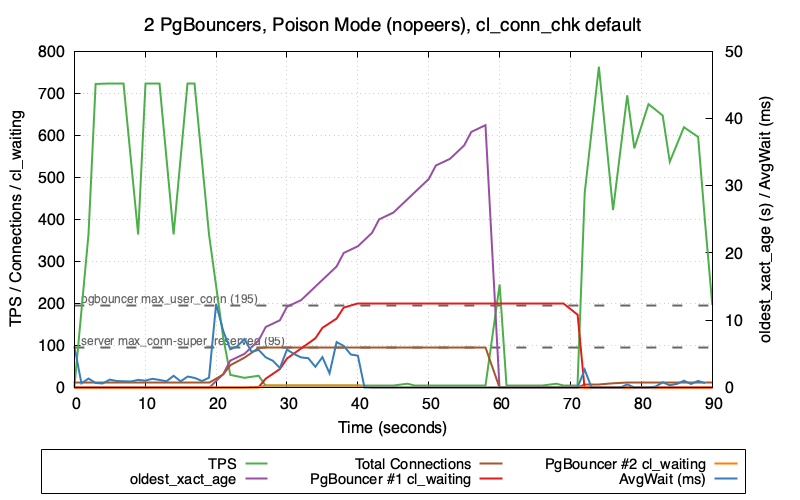
At the T=20sec mark, TPS drops from 700 to around 30. At T=26sec the total connections hit 100 (same as max_connections) and then TPS drops to almost zero. This total system outage continues until T=72sec when the system recovers after the blocking session has been killed by the transaction_timeout setting.
So what happens if we set client_connection_check_interval to 15 seconds? Quick addition to docker-compose.yml and we find out!
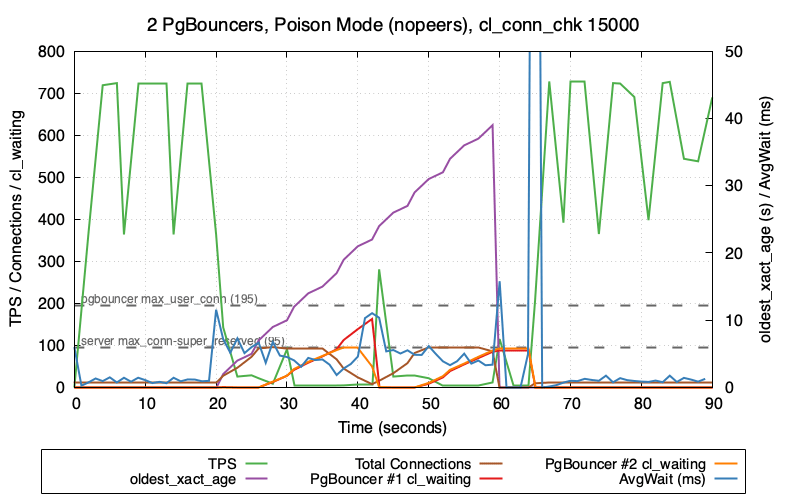
Fascinating! The brown line and the red line are the important ones. As before, the TPS drops at T=20sec and zeros out after we hit max_connections. But at T=35sec we start to see the total connection count slowly decrease! This continues until T=42sec when the PgBouncer connections are finally released – and at this point we repeat the whole cycle a second time, as the number of total connections climbs back up to the max.
So we can see that the 15 second client_connection_check_interval setting is working exactly as expected (if a little slowly) – at the 15 second mark Postgres begins to clean up the dead connections.
What if we do a lower setting like 2 seconds?
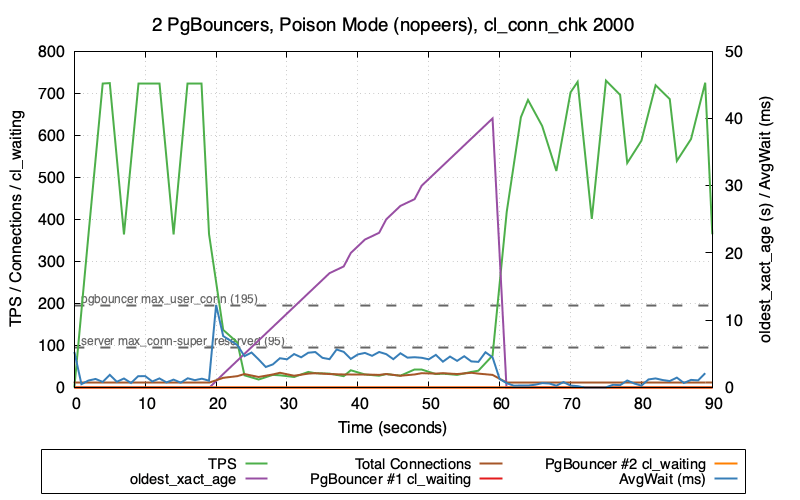
This looks even better! The total connections climbs to around 30-ish and holds stable there. And more importantly, the TPS never crashes out all the way to zero and the system is able to continue with a small workload until the blocking session is killed.
There is definitely some connection churn happening here (expected due to golang context timeouts) and with Postgres taking 2 seconds to clear them out, equilibrium is apparently around 30. A higher attempted TPS would bring this value higher.
Lets try one more time with an even lower setting of 500ms:
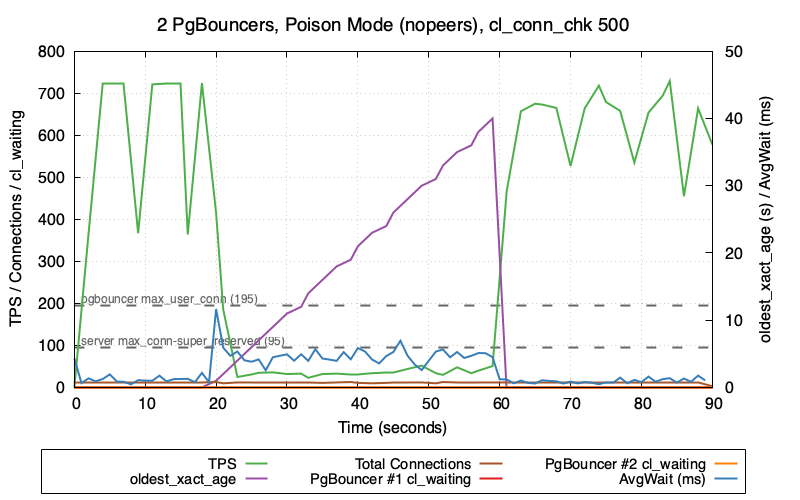
The TPS seems around the same and this time the connection count seems to stay very low.
Finally, lets take a look at the networking stack from the OS perspective at the number of sockets in CLOSE-WAIT state:
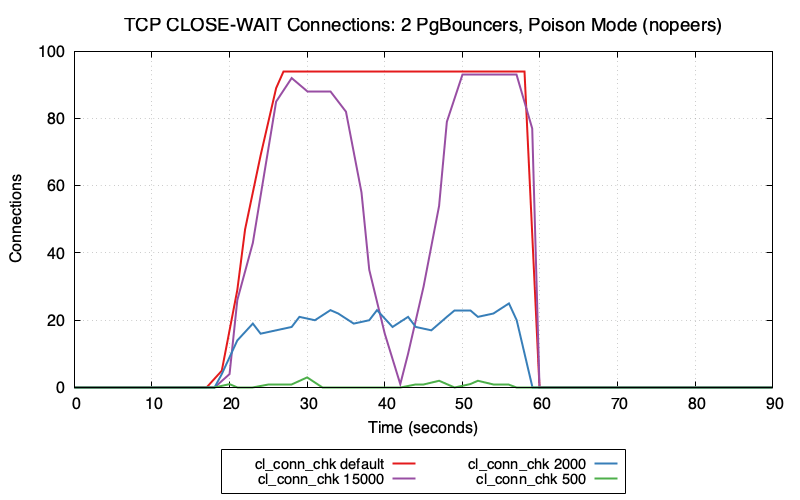
This is where the impact of client_connection_check_interval becomes very clear. Postgres is working exactly as expected and cleaning up dead connections based on the delay that’s specified in this parameter.
I find myself agreeing with Marat on LinkedIn, and I feel like there’s a strong case for giving this parameter a default value.
And now please excuse me while I go update my original blog post. 🙂


Jeremy,
Great blog post. I found it while researching client_connection_check_interval and its ramifications. I also noted the thread in the postgresql dev email list and the pgx bug. Last year I had an experience that having this interval set would have assisted with (though not certain it would have eliminated the connection pileup I experienced) and possibly prevented or limited a manual intervention of the situation. I wholeheartedly agree this should be defaulted to on with a sensible limit.
Thanks for the info!
Richard
LikeLiked by 1 person
Posted by Richard Ahlquist | March 20, 2026, 11:19 am