A few days ago, Shaun Thomas published an article over on the pgEdge blog called [Checkpoints, Write Storms, and You]. Sadly a lot of corporate blogs don’t have comment functionality anymore. I left a few comments [on LinkedIn], but overall let me say this article is a great read, and I’m always happy to see someone dive into an important and overlooked topic, present a good technical description, and include real test results to illustrate the details.
I don’t have any reproducible real test results today. But I have a good story and a little real data.
Vacuum tuning in Postgres is considered by some to be a dark art. Few can confidently say: “Yes I know the right value for autovacuum_cost_delay.” The documentation gives guidance, blog posts give opinions, and sooner or later, you start thinking, “Surely I can just set this one to zero – what’s the worst that could happen?”
My own story starts with some unexplained, intermittent application performance problems. We were doing some internal benchmarking to see just how far we could push a particular stack and see how much throughput a specific application could get. Everything hums along fine until suddenly – latency would spike across the board and the application would choke, causing backlogs and work queues to blow up throughout the system.
Where do you start when you have application performance problems? Wait Events and Top SQL – always! I’m far from the first person to evangelize this idea; I’ve said many times that wait events and top SQL are almost always the fastest way to discover where the bottlenecks are when you see unexpected performance problems. My [2024 SCaLE talk about wait events] gets into this.
So naturally I dug into the wait events and top SQL – and I noticed these slowdowns lined up perfectly with spikes in COMMIT statements on IPC:SyncRep waits. This wait event is not well understood. Last October I published an article [Explaining IPC:SyncRep – Postgres Sync Replication is Not Actually Sync Replication] with more explanation – but essentially it means the replicas were lagging behind and the primary was blocking on commit acknowledgments.
Notice how there are periodic spikes of hundreds of connections waiting on IPC:SyncRep for this system during the test runs: (nb. the plain colon represents CPU time)
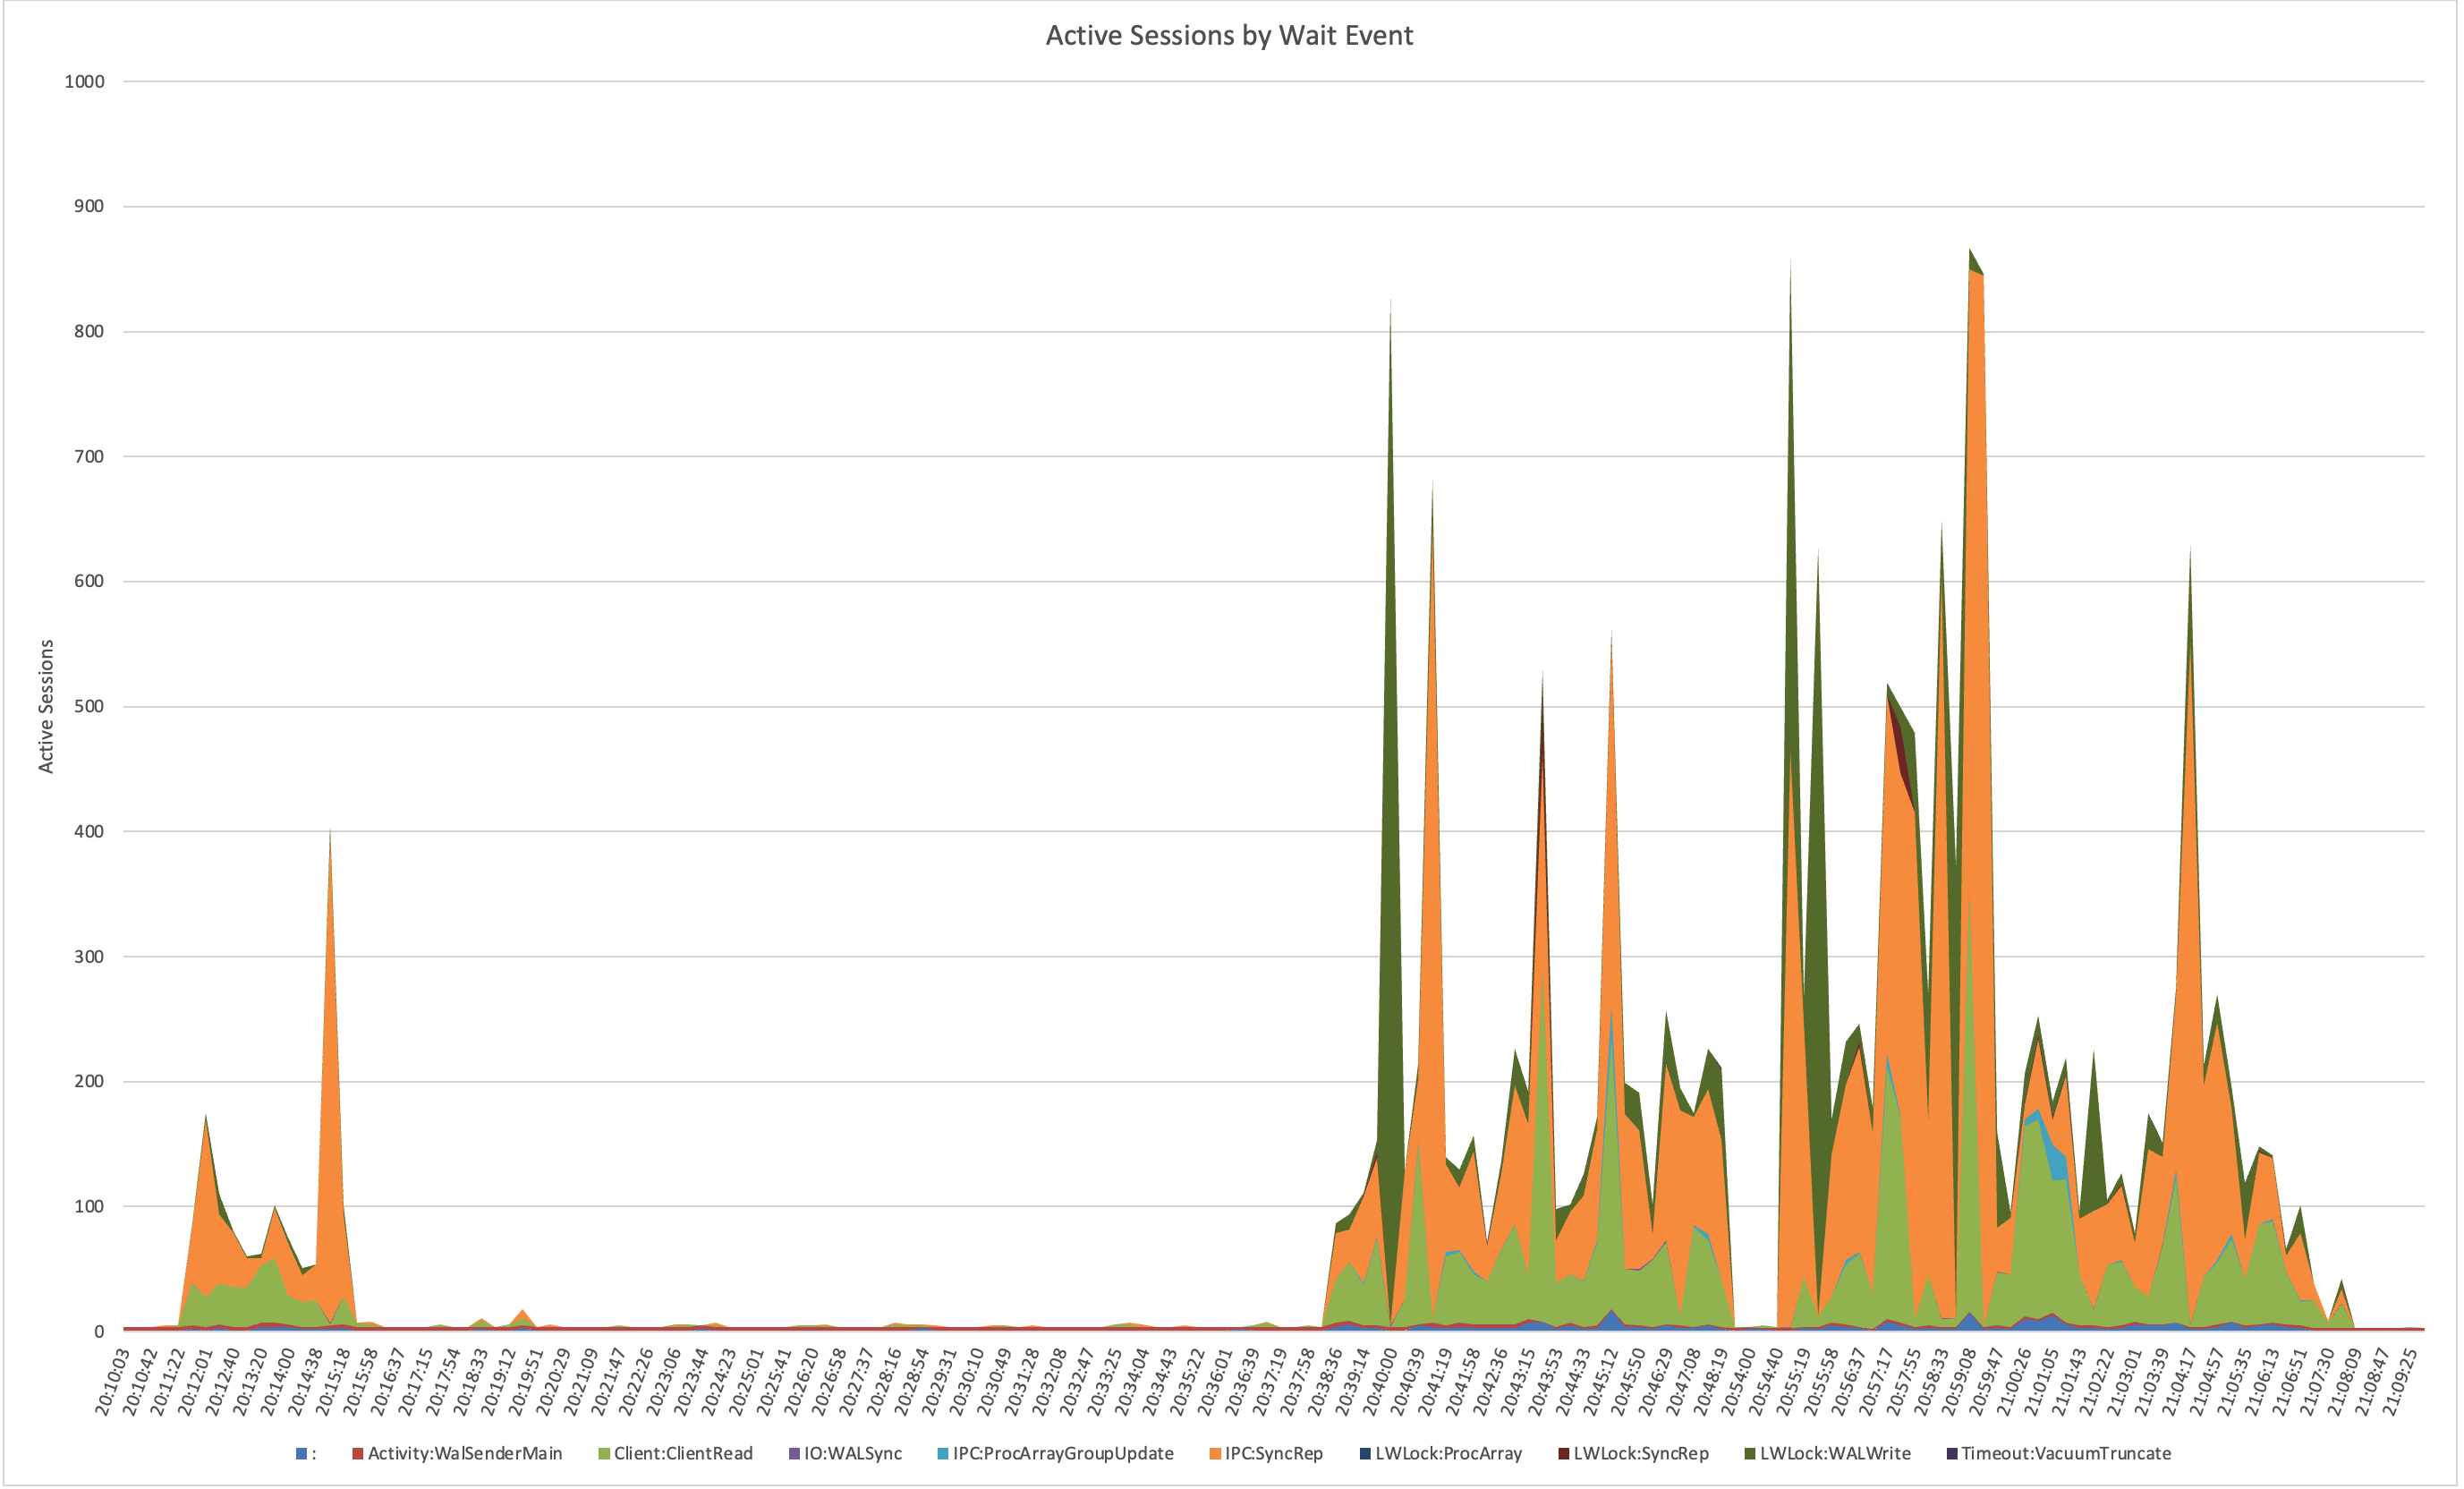
That led me to check network traffic, which showed corresponding bursts of traffic between the primary and replicas. Something was periodically creating giant spikes of WAL.
So, I went hunting in the WAL itself. Using pg_walinspect on Postgres 16, I broke down records by resource manager and found massive surges from XLOG; specifically from full-page image (FPI) writes. These weren’t steady; they came in waves and caused serious commit latency waiting for downstream replication.
Here’s a graph of the record_size and fpi_size bytes per resource type during two benchmark runs:
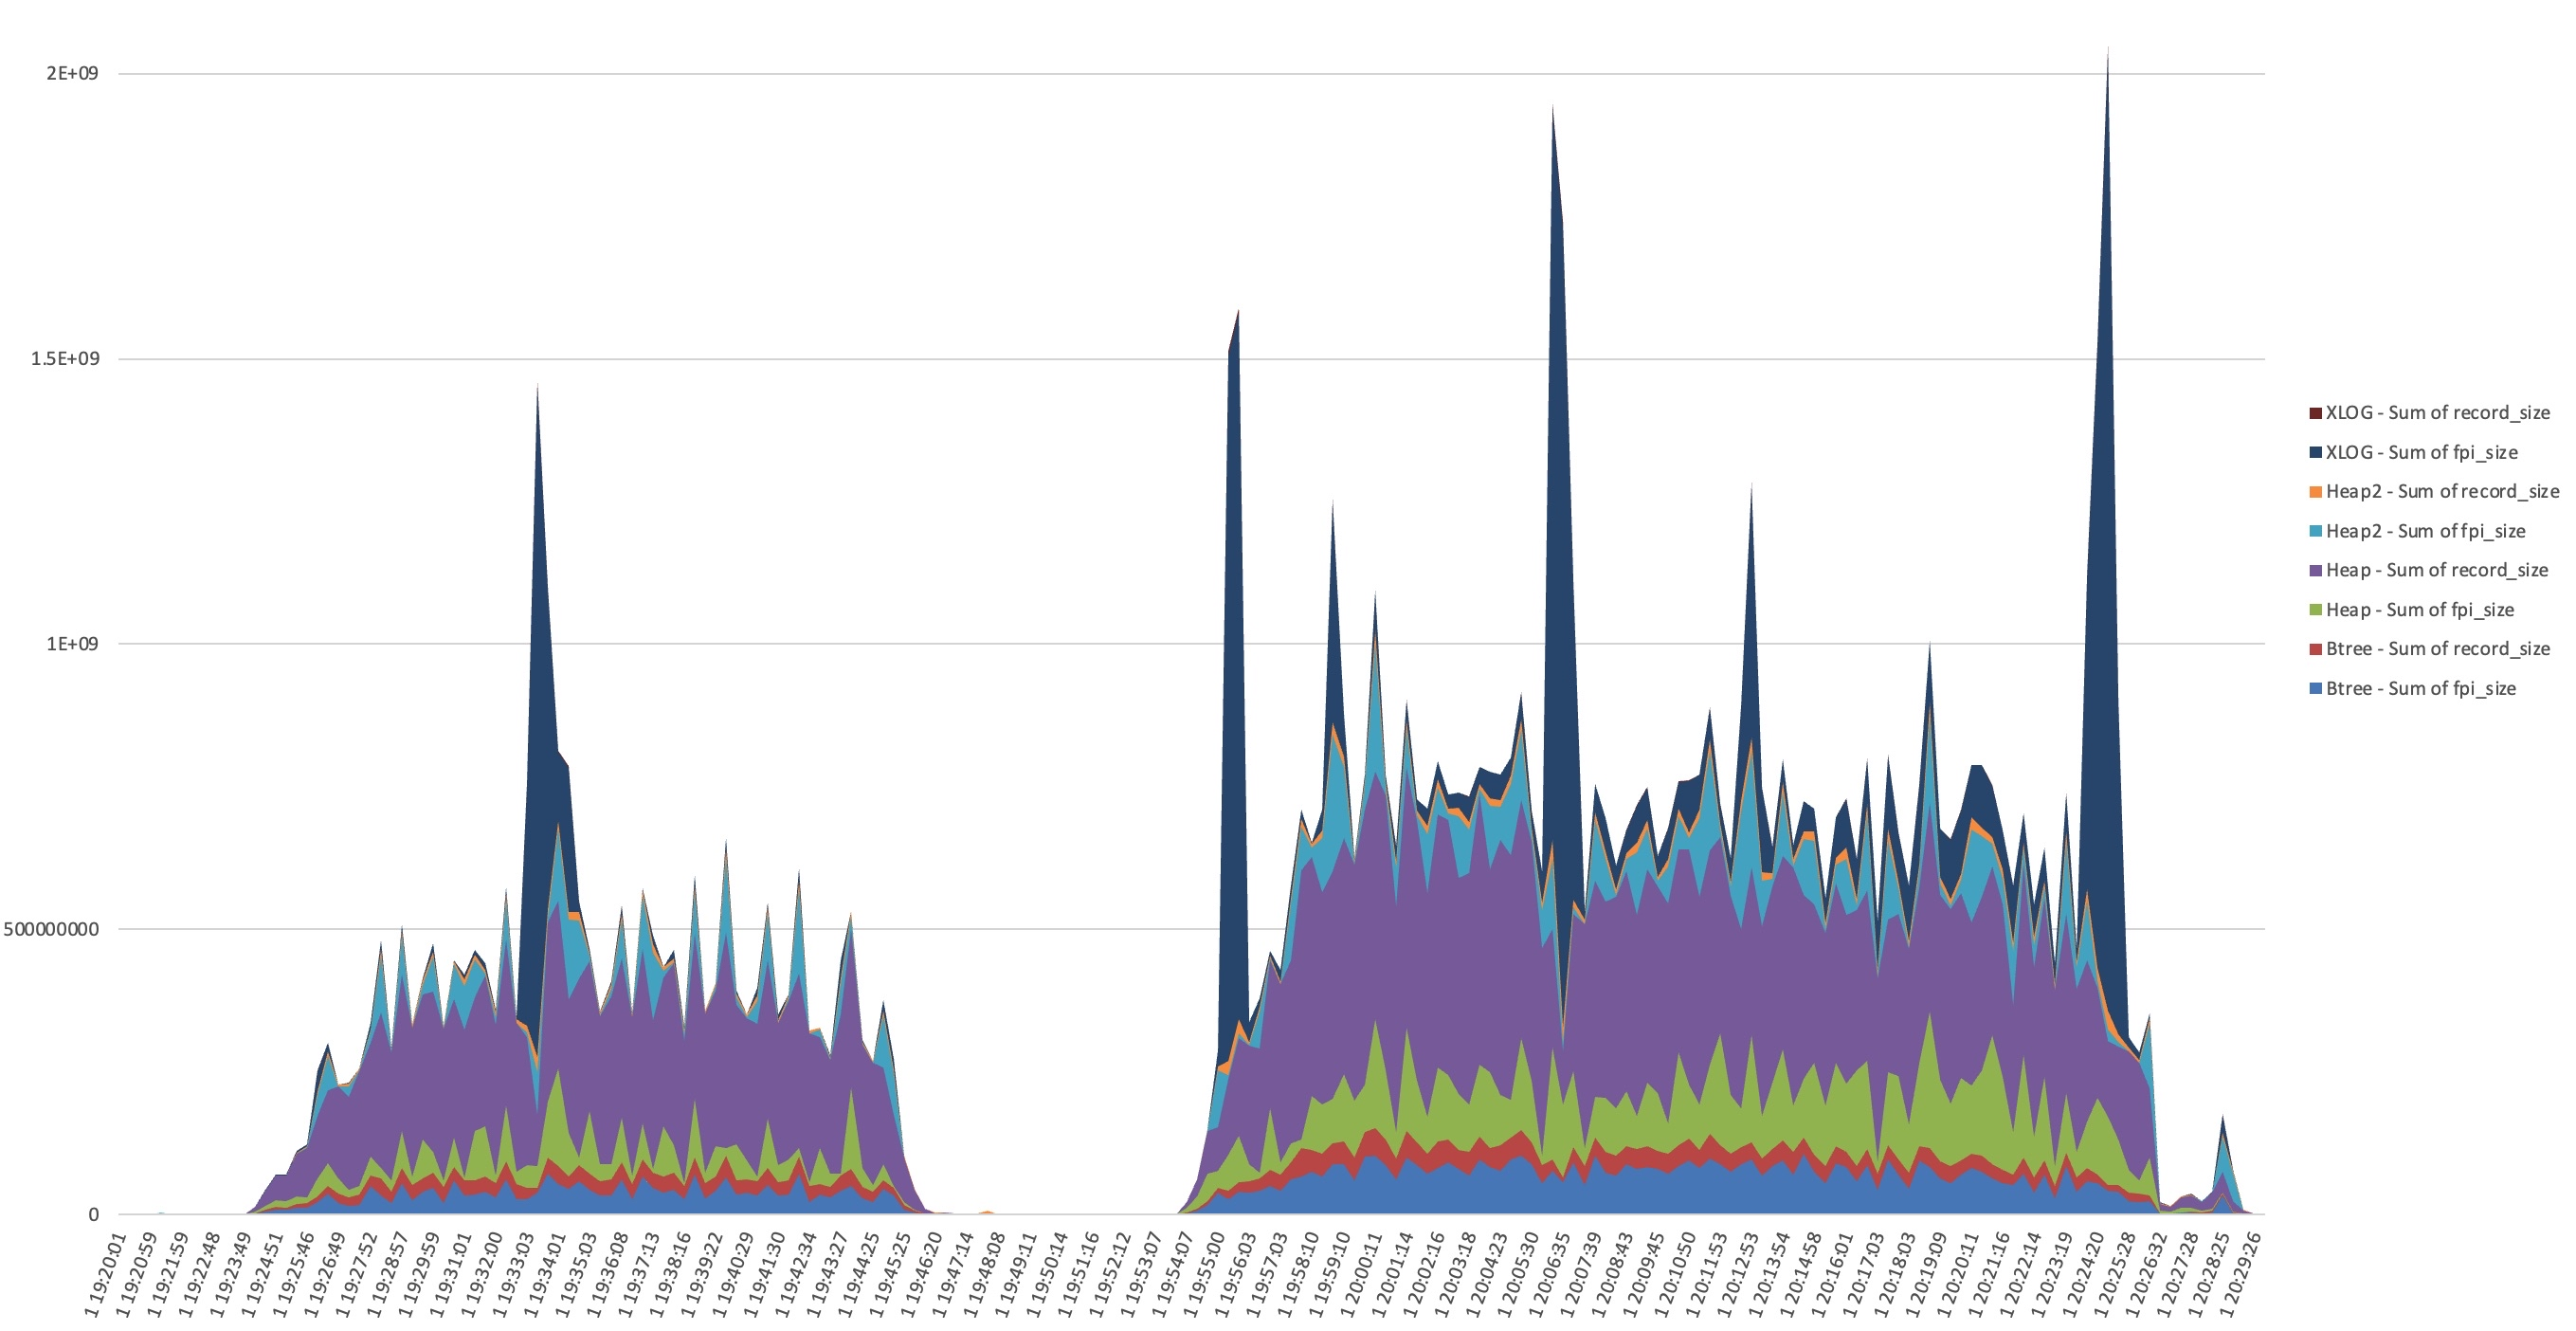
I dumped the WAL and in the first sample I see it’s dominated by FPI_FOR_HINT blocks in sequential order from a specific 40GB toast table. I only see INSERT in pg_stat_statements for this table.
This confused me. Looking through Postgres source code, two possible sources I saw were log_newpage*() and MarkBufferDirtyHint() and I thought: where are these hint updates coming from? A Postgres SELECT can dirty pages by setting tuple hint bits when it reads rows whose inserting or deleting transaction has committed but whose visibility status has not yet been cached in the tuple header, which commonly happens after recent inserts, updates, deletes, or other write activity. Some napkin math suggested that 20,000 tuple ins/upd/del per second can dirty 10GB in one minute with hints. (We were close to 20k tuples/s in the run on the left side; second workload is over 30k/s.) Maybe spikes in dirty buffers were triggering forced checkpoints?
But after taking a look, the problem here wasn’t checkpoints themselves. A lot more checkpoints were happening than WAL spikes and there was no correlation between the timings. (You should still read Shaun’s blog though!)
But this is where the trail leads me to start thinking about autovacuum. From autovacuum logs (always enable these) I could see that the timing of autovacuum runs aligned perfectly with each WAL storm.
And then I had another realization: autovacuum_cost_delay was set to 0 on this system. Crazy theory number two: vacuum is setting hint bits on an append only table very fast, and maybe the longer the gap between checkpoint and vacuum, the worse the damage? Remember that the first time a page is modified after checkpoint, the full page is written into the WAL log to protect from torn writes during system failures (because the OS block size usually doesn’t align with the database block size). Even if the update is just setting a hint bit – the WAL record can include the full 8k database block.
Without any cost throttling, autovacuum was racing through large tables at full speed, dirtying pages with hint bit updates – writing the full pages to the WAL log faster than the system could replicate them. That triggered bursts of WAL traffic, replication lag, and the intermittent major performance hiccups that had started this whole chase.
We reverted autovacuum_cost_delay to its default 2ms, reran the workload, and everything smoothed out beautifully. You can still see the XLOG records generated by autovacuum, but they were more spread out. The WAL volume didn’t swing as wildly, replication didn’t crash as dramatically, and application latency spikes no longer overwhelmed backlogs and work queues. There was still variance in the performance – but we could tune the application to handle it, and we got much higher overall throughput without tipping everything over.
In hindsight, I remember seeing that setting early on and thinking,
“it’s a big server & workload, cost delay 0 won’t do anything that bad, won’t completely burn down the server, so I can probably let that one stay where it is”
I was completely wrong.
Moral of the story:
Vacuum tuning may feel like a dark art, but the defaults exist for good reason. Even one millisecond of cost delay keeps autovacuum from overwhelming the system and flooding WAL. Checkpoints and pg_repack and materialized view refreshes aren’t the only things that cause write storms; autovacuum can cause them too.
In other words: resist the temptation to go full throttle – your replicas and your applications and your future-self will thank you.


Discussion
No comments yet.