Before starting, I want to put a few things at the top:
- You probably should not change the
checkpoint_timeoutsetting from its default of 5 minutes. Users who read tuning advice on the internet (or get bad AI advice) about increasing this setting usually don’t understand the risk and significance of trading for RTO/availability. Let’s be honest: many of us don’t scrutinize RTO until we have a real incident and suddenly realize that there is no way to get our application back online. Turns out it does matter to your boss if you’re down! Increasing this parameter can turn a short outage into a long multi-hour outage. - Always make sure
log_checkpointsis enabled. This has been the default since Postgres v15. - With a default checkpoint_timeout setting of 5 minutes, I’m leaning toward a default alarming threshold of 15 minutes on total checkpoint time. You may need to increase disk hardware specs or optimize database workload, if checkpoints take too long.
- There are two ways this alarm can be built – either by parsing checkpoint messages after they appear in the log, or by looking at the current time and checking how long since the last checkpoint message appeared. The latter is a more robust solution because it will alarm even if no checkpoint message is ever produced.
- Don’t forget to also monitor for “checkpoints are occurring too frequently” messages in the Postgres log. In some cases, you might consider increasing
max_wal_sizeif checkpoints are frequent. Remember that it’s ok if there are short occasional bursts of write activity. The thing to watch for is real user & application impact due to extended throttling.
Checkpoint is the heart of your database. It’s buried deep inside. It’s not something everyone talks about, like well-tuned autovacuum or fast queries. But if checkpointer stops beating, then you’re dead.
In addition to its well-understood job of getting dirty pages written from cache to disk in the background, it also has many smaller jobs that are less widely known. Management of a few shared-memory config settings like sync_standby_names and full_page_writes. Fsync Batching. Deferred file unlinks. Enforcement of archive_timeout.
A few years ago, I added a happiness hint to have an alarm on the “time since latest checkpoint”. This was partly due to an incident I saw many years ago but which I never managed to blog about. I saw another checkpoint related incident recently, so I thought I’d gather these thoughts together. Both incidents reveal an important lesson in hindsight: it’s dangerous to restart a database when there are checkpoint problems.
The First Incident
Lets see what I can remember about that original incident. It was an ugly 40 hour production outage that happened back in the postgres version 12 era. Someone started getting errors and restarted their postgres database to try to remediate, and the database simply never came back up.
I remember that there were four different things which all combined to make this incident so bad:
- The workload made heavy use of unlogged tables. It created and dropped tables at a high rate.
- Somehow there had not been a successful checkpoint on this database for a week. There was insufficient data to figure out why, after we finally got the system back online.
- Remember that one job of checkpointer is to handle deferred file unlinks. Over the course of the week, while checkpointer was stalled and never unlinked any of the underlying files for the
DROP <relation>statements, the system accumulated 27 million files on the filesystem until it ran out of inodes (before the database was restarted).
- Remember that one job of checkpointer is to handle deferred file unlinks. Over the course of the week, while checkpointer was stalled and never unlinked any of the underlying files for the
- The database was on a large server and had a reasonably large buffer cache. In Postgres, any time a relation is dropped, the entire buffer cache is scanned to remove blocks belonging to that relation. (Some other databases maintain an index type of structure for this but Postgres does not.) This includes unlogged tables and their indexes.
- When Postgres starts, the first thing it needs to do is replay write-ahead logs starting at the last successful checkpoint. This database needed to replay more than twenty-five thousand WAL files.
The reason the database never came back up was that WAL replay proceeded at a crawl (due to buffer cache scans), and after running for many hours it would inevitably cause the system to run out of inodes again. It would crash before it could complete recovery. When it restarted again, it lost all progress and went back to the beginning.
Eventually we shrank the buffer cache to speed up replay, but recovery was still incredibly slow – and at the end of the day, as stated above, this ended up being almost two days of production downtime.
At the root of this was a severely lagging checkpointer.
The Second Incident
The next incident was more recent and involved a hot standby instance, and a multi-hour outage for that hot standby instance. This time it was a CloudNativePG database running on Kubernetes – but similarly to before, the application was experiencing problems and a database restart was triggered as an early remediation. The hot standby instance never came back up.
Again, a few different factors combined to cause the incident:
- The workload on the primary experienced a significant increase in write activity. This was running on cloud infrastructure and the underlying disk flatlined at its maximum IOPS with 100% writes. Hot standby databases had identically configured disks and needed to apply the same write activity as the primary (because they are replicating writes).
- Checkpoints on the primary began to fall significantly behind. Even with a
checkpoint_timeoutof 5 minutes, checkpoints are taking up to an hour to complete and spending the bulk of that time waiting for write IO. (eg.write=2550s, total=3130s). - From an initial pass of postgres recovery code, I think that a replica doesn’t write its first restartpoint until it encounters its second checkpoint record in the WAL stream. Reference
CreateRestartPoint()inxlog.cwhere it says(!XLogRecPtrIsValid(lastCheckPointRecPtr) || lastCheckPoint.redo <= ControlFile->checkPointCopy.redo) - Because of the overloaded checkpointer, when the hot standby restarted, reaching the second checkpoint from the restartpoint required replaying ~328 GB total. The WAL records are generated by many connections in parallel, but crash recovery needs to replay the records single-threaded… so it usually takes longer to replay WAL logs than it took to generate them.
- CloudNativePG was configured with a 60-minute startup probe timeout which would kill and restart the pod if it didn’t open for queries within that time. With the disk I/O still saturated, it was unreachable. This produced a loop: the standby was killed at 18:11, 19:11, 20:11, 21:11, 22:12, 23:12, 00:12, 01:12 — ten hourly restarts over ~8.5 hours. Every hourly session decoded the same 128.6 GB of WAL, preserved none of it across restarts, and terminated at the same position.
I’ve drafted a proposal for a CNPG fix, but again – at the root of this was a severely lagging checkpointer.
Illustrating a Lagging Checkpointer
What does a lagging checkpointer look like? Lets look at some real examples of healthy and unhealthy systems.
For these examples, I’m using the following LogQL query:
avg_over_time({namespace="<my-namespace-with-single-cnpg-cluster>"}
   |~ `checkpoint complete`
   | regexp `write=([0-9]+\.[0-9]+) s, sync=([0-9]+\.[0-9]+) s, total=(?P<total_duration>[0-9]+\.[0-9]+) s`
   | unwrap total_duration [$__auto])
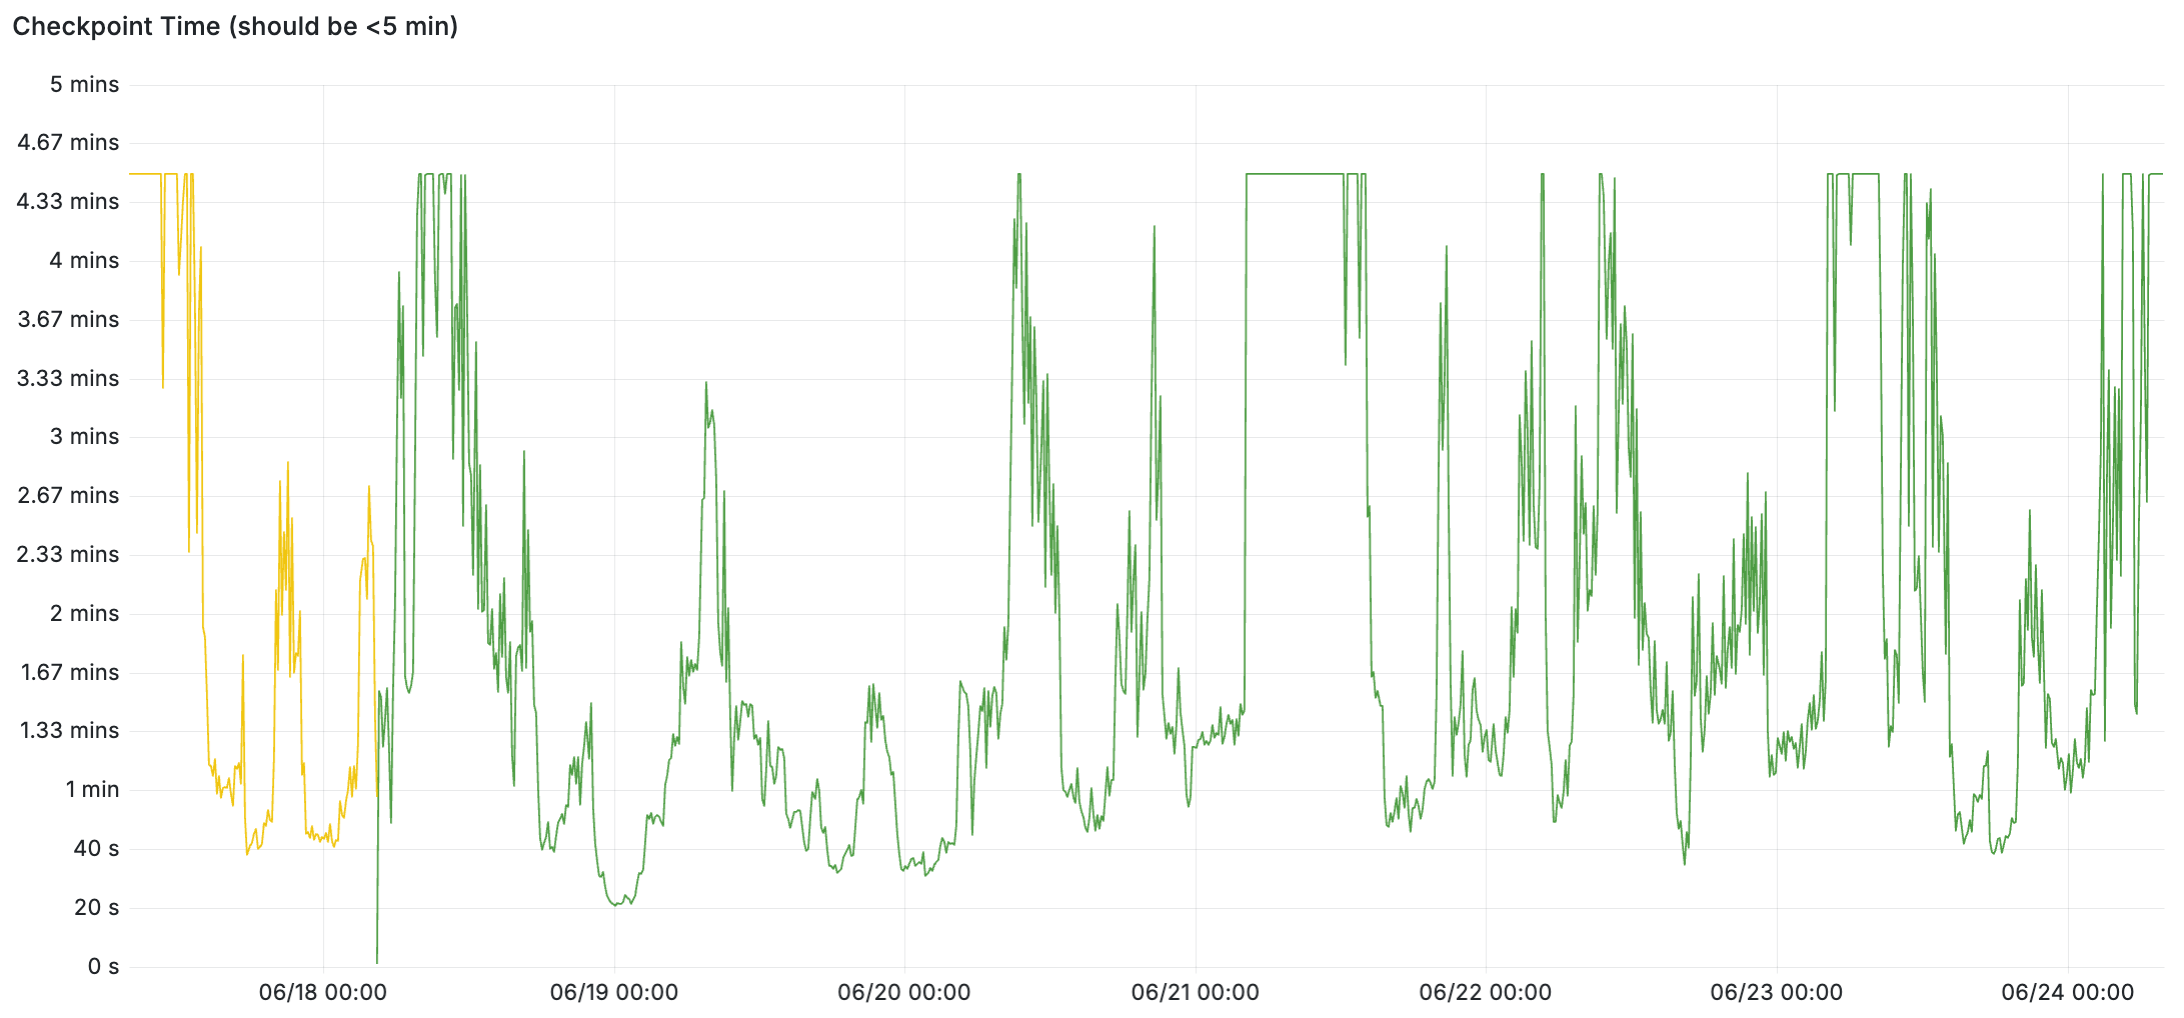
We’ll start with an example of a healthy system. Checkpoints complete quickly when it’s idle, and under load the checkpoints are spread over the full 5 minutes. But the checkpoints are keeping up fine. Postgres checkpointer is smart and actually throttles itself to try to use the full 5 minutes to spread out the writes that it needs to complete. (You can tune this with the checkpoint_completion_target parameter.)
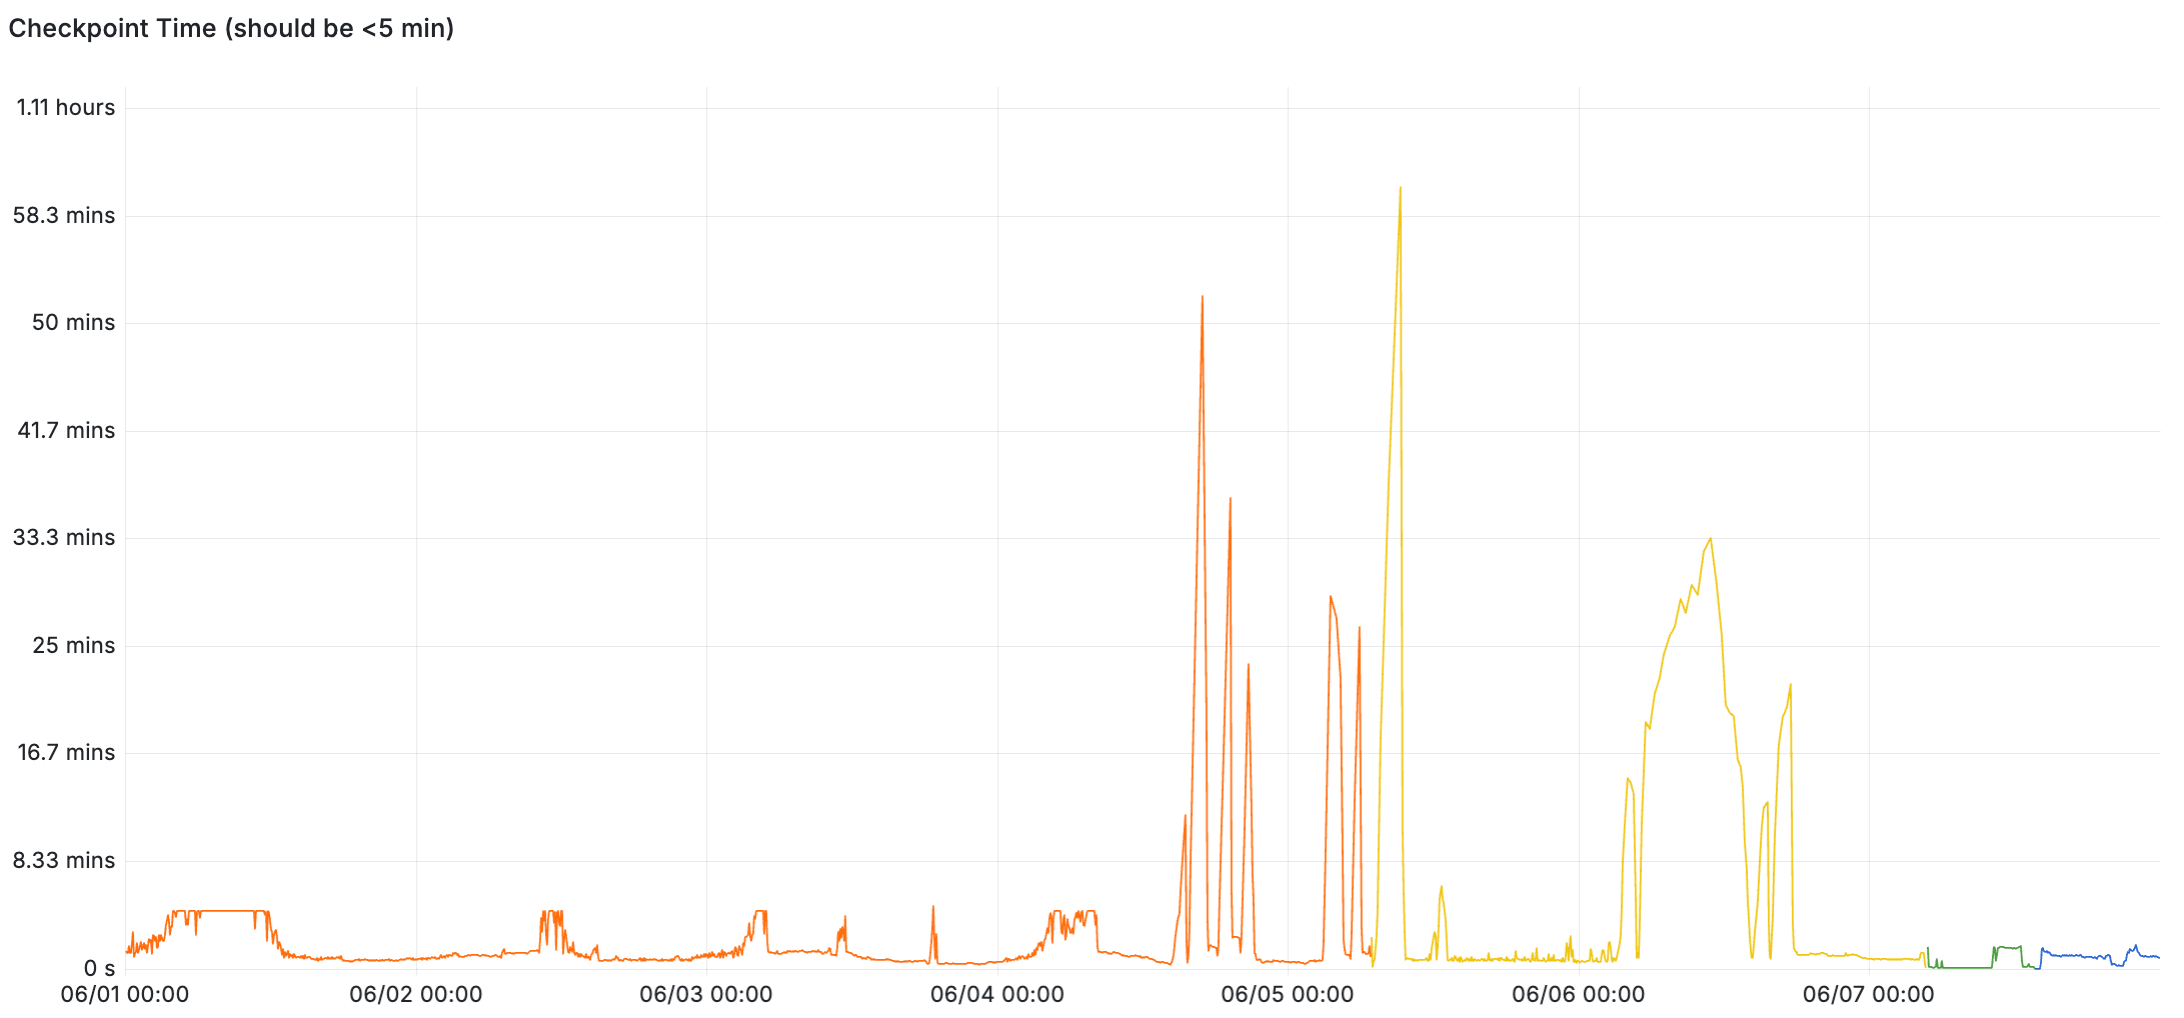
Here’s an example of an unhealthy system. Up until June 4, the checkpoints were completing within five minutes – but once the system gets overloaded, checkpoint times skyrocket up to an hour at times. This example is from the second incident above, where the lagging checkpoint was driven by increased write workload and storage that’s bottlenecked on write IOPS.
And remember: if your database is experiencing a lagging or stalled checkpointer, don’t restart it!


Discussion
No comments yet.