This month I worked with a chicagoland company to improve performance for eBusiness Suite on AIX. I’ve worked with databases running on AIX a number of times over the years now. Nevertheless, I got thrown for a loop this week.
TLDR: In the end, it came down to a fundamental change in resource accounting that IBM introduced with the POWER7 processor in 2010. The bottom line is twofold:
- if SMT is enabled then the meaning of CPU utilization numbers is changed. the CPU utilization numbers for individual processes mean something completely new.
- oracle database 11.2.0.3 (I haven’t tested newer versions but they might also be affected) is not aware of this change. as a result, all CPU time values captured in AWR reports and extended SQL traces are wrong and misleading if it’s running on AIX/POWER7/SMT. (I haven’t tested CPU time values at other places in the database but they might also be wrong.)
On other unix operating systems (for example Linux with Intel Hyper-Threading), the CPU numbers for an individual process reflect the time that the process spent on the CPU. It’s pretty straightforward: 100% means that the process is spending 100% of its time on the logical CPU (a.k.a. thread – each hardware thread context on a hyper-threaded core appears as a CPU in Linux). However AIX with SMT is different. On AIX, when you look at an individual process, the CPU utilization numbers reflect IBM’s opinion about what percentage of physical capacity is being used.
Why did IBM do this? I think that their overall goal was to help us in system-wide monitoring and capacity planning – however it came at the expense of tuning individual processes. They are trying to address real shortcomings inherent to SMT – but as someone who does a lot of performance optimization, I find that their changes made my life a lot more difficult!
History
Ls Cheng started a conversation in November 2012 on the Oracle-L mailing list about his database on AIX with SMT enabled, where the CPU numbers in the AWR report didn’t even come close to adding up correctly. Jonathan Lewis argued that double-counting was the simplest explanation while Karl Arao made the case for time in the CPU run queue. A final resolution as never posted to the list – but in hindsight it was almost certainly the same problem I’m investigating in this article. It fooled all of us. CPU intensive workloads on AIX/Power7/SMT will frequently mislead performance experts into thinking there is a CPU runqueue problem at the OS level. In fact, after researching for this article I went back and looked at my own final report from a consulting engagement with an AIX/SMT client back in August 2011 and realized that I made this mistake myself!
As far as I’m aware, Marcin Przepiorowski was the first person to really “crack” the case when and he researched and published a detailed explanation back in February 2013 with his article Oracle on AIX – where’s my cpu time?. Marcin was tipped off by Steve Pittman’s detailed explanation published in a December 2012 article Understanding Processor Utilization on Power Systems – AIX. Karl Arao was also researching it back in 2013 and published a lot of information on his tricky cpu aix stuff tiddlywiki page. Finally, Graham Wood was digging into it at the same time and contributed to several conversations amongst oak table members. Just to be clear that I’m not posting any kind of new discovery! :)
However – despite the fact that it’s been in the public for a few years – most people don’t understand just how significant this is, or even understand exactly what the problem is in technical terms. So this is where I think I can make a contribution: by giving a few simple demonstrations of the behavior which Steve, Marcin and Karl have documented.
CPU and Multitasking
I recently spent a few years leading database operations for a cloud/SaaS company. Perhaps one of the most striking aspects of this job was that I had crossed over… from being one of the “young guys” to being one of the “old guys”! I certainly wasn’t the oldest guy at the company but more than half my co-workers were younger than me!
Well my generation might be the last one to remember owning personal computers that didn’t multitask. Ok… I know that I’m still working alongside plenty of folks who learned to program on punch-cards. But at the other end of the spectrum, I think that DOS was already obsolete when many of my younger coworkers starting using technology! Some of you younger devs started with Windows 95. You’ve always had computers that could run two programs in different windows at the same time.
Sometimes you take a little more notice of tech advancements you personally experience and appreciate. I remember it being a big deal when my family got our first computer that could do more than one thing at a time! Multitasking (or time sharing) is not a complicated concept. But it’s important and foundational.
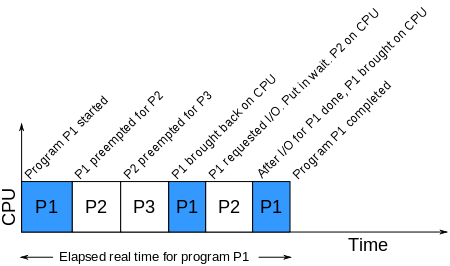
CPU Time on Single CPU Multi Tasking System
CPU color time for program P1
So obviously (I hope), if there are multiple processes and only a single CPU then the processes will take turns running. There are some nuances around if, when and how the operating system might force a process to get off the CPU but the most important thing to understand is just the timeline pictured above. Because for the rest of this blog post we will be talking about performance and time.
Here is a concrete example of the illustration above: one core in my laptop CPU can copy 13GB of data through memory in about 4-5 seconds:
$ time -p taskset 2 dd if=/dev/zero of=/dev/null bs=64k count=200k
204800+0 records in
204800+0 records out
13421772800 bytes (13 GB) copied, 4.73811 s, 2.8 GB/s
real 4.74
user 0.13
sys 4.54
The “taskset” command on linux pins a command on a specific CPU #2 – so “dd” is only allowed to execute on that CPU. This way, my example runs exactly like the illustration above, with just a single CPU.
What happens if we run two jobs at the same time on that CPU?
$ time -p taskset 2 dd if=/dev/zero of=/dev/null bs=64k count=200k &
[1] 18740

$ time -p taskset 2 dd if=/dev/zero of=/dev/null bs=64k count=200k &
[2] 18742

204800+0 records in
204800+0 records out
13421772800 bytes (13 GB) copied, 9.25034 s, 1.5 GB/s
real 9.25
user 0.09
sys 4.57
204800+0 records in
204800+0 records out
13421772800 bytes (13 GB) copied, 9.22493 s, 1.5 GB/s
real 9.24
user 0.12
sys 4.54

[1]-  Done                    time -p taskset 2 dd if=/dev/zero of=/dev/null bs=64k count=200k
[2]+  Done                    time -p taskset 2 dd if=/dev/zero of=/dev/null bs=64k count=200k
Naturally, it takes twice as long – 9-10 seconds. I ran these commands on my linux laptop but the same results could be observed on any platform. By the way, notice that the “sys” number was still 4-5 seconds. This means that each process was actually executing on the CPU for 4-5 seconds even though it took 9-10 seconds of wall clock time.
The “time” command above provides a summary of how much real (wall-clock) time has elapsed and how much time the process was executing on the CPU in both user and system modes. This time is tracked and accounted for by the operating system kernel. The linux “time” command uses the wait4() system call to retrieve the CPU accounting information. This can be verified with strace:
$ strace -t time -p dd if=/dev/zero of=/dev/null bs=64k count=200k
10:07:06 execve("/usr/bin/time", ["time", "-p", "dd", "if=/dev/zero", "of=/dev/null", \
        "bs=64k", "count=200k"], [/* 48 vars */]) = 0
...
10:07:06 clone(child_stack=0, flags=CLONE_CHILD_CLEARTID|CLONE_CHILD_SETTID|SIGCHLD, \
        child_tidptr=0x7f8f841589d0) = 12851
10:07:06 rt_sigaction(SIGINT, {SIG_IGN, [INT], SA_RESTORER|SA_RESTART, 0x7f8f83be90e0}, \
        {SIG_DFL, [], 0}, 8) = 0
10:07:06 rt_sigaction(SIGQUIT, {SIG_IGN, [QUIT], SA_RESTORER|SA_RESTART, 0x7f8f83be90e0}, \
        {SIG_IGN, [], 0}, 8) = 0
10:07:06 wait4(-1,

204800+0 records in
204800+0 records out
13421772800 bytes (13 GB) copied, 4.66168 s, 2.9 GB/s

[{WIFEXITED(s) && WEXITSTATUS(s) == 0}], 0, {ru_utime={0, 108000}, \
        ru_stime={4, 524000}, ...}) = 12851
10:07:11 --- SIGCHLD {si_signo=SIGCHLD, si_code=CLD_EXITED, si_pid=12851, si_uid=1000, \
        si_status=0, si_utime=10, si_stime=454} ---
10:07:11 rt_sigaction(SIGINT, {SIG_DFL, [INT], SA_RESTORER|SA_RESTART, 0x7f8f83be90e0}, \
        {SIG_IGN, [INT], SA_RESTORER|SA_RESTART, 0x7f8f83be90e0}, 8) = 0
10:07:11 rt_sigaction(SIGQUIT, {SIG_IGN, [QUIT], SA_RESTORER|SA_RESTART, 0x7f8f83be90e0}, \
        {SIG_IGN, [QUIT], SA_RESTORER|SA_RESTART, 0x7f8f83be90e0}, 8) = 0
10:07:11 write(2, "r", 1r)                        = 1
10:07:11 ...
Two notes about this. First, you’ll see from the timestamps that there’s a 5 second pause during the wait4() syscall and the output from “dd” interrupts its output. Clearly this is when “dd” is running. Second, you’ll see that the wait4() call is returning two variables called ru_utime and ru_stime. The man page on wait4() clarifies that this return parameter is the rusage struct which is defined in the POSIX spec. The structure is defined in time.h and is the same structure returned by getrusage() and times(). This is how the operating system kernel returns the timing information to “time” for display on the output.
CPU Utilization on Linux with Intel SMT (Hyper-Threading)
Since many people are familiar with Linux, it will be helpful to provide a side-by-side comparison of Linux/Intel/Hyper-Threading with AIX/Power7/SMT. This will also help clarify exactly what AIX is doing that’s so unusual.
For this comparison, we will switch to Amos Waterland’s useful stress utility for CPU load generation. This program is readily available for all major unix flavors and cleanly loads a CPU by spinning on the sqrt() function. I found a copy at perzl.org already ported and packaged for AIX on POWER.
For our comparison, we will load a single idle CPU for 100 seconds of wall-clock time. We know that the process will spin on the CPU for all 100 seconds, but lets see how the operating system kernel reports it.
First, lets verify that we have SMT (Hyper-Threading):
user@debian:~$ lscpu | egrep '(per|name)'
Thread(s) per core:    2
Core(s) per socket:    2
Model name:            Intel(R) Core(TM) i3-4005U CPU @ 1.70GHz
Next lets run our stress test (pinned to a single CPU) and see what the kernel reports for CPU usage:
user@debian:~$ time -p taskset 2 stress -c 1 -t 100
stress: info: [20875] dispatching hogs: 1 cpu, 0 io, 0 vm, 0 hdd
stress: info: [20875] successful run completed in 100s
real 100.00
user 100.03
sys 0.00
Just what we would expect – the system is idle, and the process was on the CPU for all 100 seconds.
Now lets use mpstat to look at the utilization of CPU #2 in a second window:
user@debian:~$ mpstat -P 1 10 12
Linux 3.16.0-4-amd64 (debian) 	06/30/2016 	_x86_64_	(4 CPU)

01:58:07 AM  CPU    %usr   %nice    %sys %iowait    %irq   %soft  %steal  %guest  %gnice   %idle
01:58:17 AM    1    0.00    0.00    0.10    0.00    0.00    0.00    0.00    0.00    0.00   99.90
01:58:27 AM    1   17.44    0.00    0.10    0.00    0.00    0.00    0.00    0.00    0.00   82.45
01:58:37 AM    1  100.00    0.00    0.00    0.00    0.00    0.00    0.00    0.00    0.00    0.00
01:58:47 AM    1  100.00    0.00    0.00    0.00    0.00    0.00    0.00    0.00    0.00    0.00
01:58:57 AM    1  100.00    0.00    0.00    0.00    0.00    0.00    0.00    0.00    0.00    0.00
01:59:07 AM    1  100.00    0.00    0.00    0.00    0.00    0.00    0.00    0.00    0.00    0.00
01:59:17 AM    1  100.00    0.00    0.00    0.00    0.00    0.00    0.00    0.00    0.00    0.00
01:59:27 AM    1  100.00    0.00    0.00    0.00    0.00    0.00    0.00    0.00    0.00    0.00
01:59:37 AM    1  100.00    0.00    0.00    0.00    0.00    0.00    0.00    0.00    0.00    0.00
01:59:47 AM    1  100.00    0.00    0.00    0.00    0.00    0.00    0.00    0.00    0.00    0.00
01:59:57 AM    1  100.00    0.00    0.00    0.00    0.00    0.00    0.00    0.00    0.00    0.00
02:00:07 AM    1   82.88    0.00    0.10    0.00    0.00    0.00    0.00    0.00    0.00   17.02
Average:       1   83.52    0.00    0.03    0.00    0.00    0.00    0.00    0.00    0.00   16.45
Again, no surprises here. We see that the CPU was running at 100% for the duration of our stress test.
Next lets check the system-wide view. On linux, most people use the top command to see what’s happening system-wide. Top shows a list of processes and estimates how much time each spends on the CPU. Note that the “top” utility is using the /proc/<PID>/stat file to get kernel-tracked CPU time rather than libc calls – but this still returns the same data as the “time” command. It then divides by wall-clock time to express the CPU time as a percentage. If two processes are running on one CPU, then each process will report 50% CPU utilization (in the default Irix mode).
We will run top in a third window while the stress and mpstat programs are running to get the system-wide view:
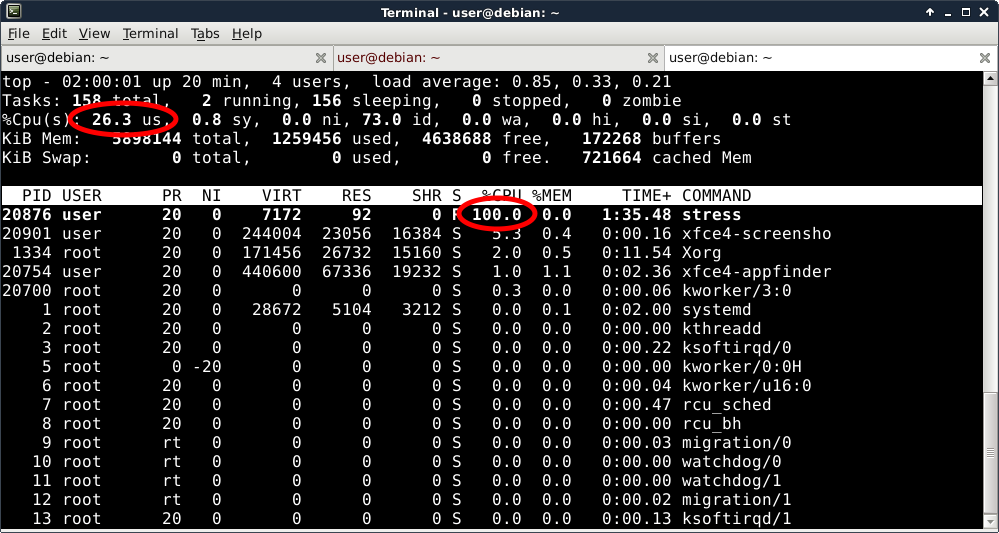
Linux top (in Irix mode) reports that the “stress” program is using 100% of a single CPU and that 26.3% of my total CPU capacity is used by the system.
This is wrong. Did you spot the problem with my statement above? If you have any linux servers with hyper-threading enabled then I really hope you understand this!
The problem is with the second statement – that 26% of my total CPU capacity is used. In reality, a “hardware thread” is nothing like a “real core”. (For Oracle specific details about Hyper-Threading and CPU Capacity, Karl Arao might be one of the best sources of information.) Linux kernel developers represent each hardware thread as a logical CPU. As a result (and this is counter-intuitive) it’s very misleading to look at that “total CPU utilization” number as something related to total CPU capacity.
What does this mean for you? You must set your CPU monitoring thresholds on Linux/Hyper-Threading very low. You might set your critical threshold for paging at 70%. Personally, I like to keep utilization on transactional systems under 50%. If your hyper-threaded linux system has 70% CPU utilization, then you are going to run out of CPU very soon!
Why is this important? This is exactly the problem that IBM’s AIX team aimed to solve with SMT on POWER. But there is a catch: the source data used by standard tools to calculate system-level CPU usage is the POSIX-defined “rusage” process accounting information. IBM tweaked the meaning of rusage to fix our system-level CPU reporting problem – and they introduced a new problem at the individual process level. Lets take a look.
CPU Utilization on AIX with Power SMT
First, as we did on Linux, lets verify that we have SMT (Hyper-Threading):
# prtconf|grep Processor
Processor Type: PowerPC_POWER7
Processor Implementation Mode: POWER 7
Processor Version: PV_7_Compat
Number Of Processors: 4
Processor Clock Speed: 3000 MHz
  Model Implementation: Multiple Processor, PCI bus
+ proc0                                                                         Processor
+ proc4                                                                         Processor
+ proc8                                                                         Processor
+ proc12                                                                        Processor

# lparstat -i|egrep '(Type|Capacity  )'
Type                                       : Shared-SMT-4
Entitled Capacity                          : 2.00
Minimum Capacity                           : 2.00
Maximum Capacity                           : 4.00
So you can see that we’re working with 2 to 4 POWER7 processors in SMT4 mode, which will appear as 8 to 16 logical processors.
Now lets run the exact same stress test, again pinned to a single CPU.
# ps -o THREAD
    USER      PID     PPID       TID ST  CP PRI SC    WCHAN        F     TT BND COMMAND
jschneid 13238466 28704946         - A    0  60  1        -   240001  pts/0   - -ksh
jschneid  9044322 13238466         - A    3  61  1        -   200001  pts/0   - ps -o THREAD

# bindprocessor 13238466 4

# /usr/bin/time -p ./stress -c 1 -t 100
stress: info: [19398818] dispatching hogs: 1 cpu, 0 io, 0 vm, 0 hdd
stress: info: [19398818] successful run completed in 100s

Real   100.00
User   65.01
System 0.00
Wait… where did my CPU time go?! (This is one of the first things Marcin noticed too!) The AIX kernel reported that my process ran for 100 seconds of wall-clock time, but it was only running on the CPU for 65 seconds of that time!
On unix flavors such as Linux, this means that the operating system was not trying to put the process on the CPU during the missing time. Maybe the process was waiting for a disk operation or a signal from another process. But our stress test only executes the sqrt() function – so we know that it was not waiting for anything.
When you know the process was not waiting, there is only other reason the operating system wouldn’t put the process on the CPU. Look again at our very first demo in this article: two (or more) processes needed to share the CPU. And notice that the user+system time was lower than wall-clock time, exactly like our output here on AIX!
So lets take a look at the system-wide view with the “nmon” utility in a second window. (topas reports CPU usage solaris-style while nmon reports irix-style, so nmon will be more suitable for this test. they are actually the same binary anyway, just invoked differently.)

Wait… this doesn’t seem right! Our “stress” process is the only process running on the system, and we know that it is just spinning CPU with the sqrt() call. The “nmon” tool seems to verify the output of the time command – that the process is only on the CPU for 65% of the time! Why isn’t AIX letting my process run on the CPU?!
Lets take a look at the output of the mpstat command, which we are running in our third window:
# mpstat 10 12|egrep '(cpu|^  4)'
System configuration: lcpu=16 ent=2.0 mode=Uncapped
cpu  min  maj  mpc  int   cs  ics   rq  mig lpa sysc us sy wa id   pc  %ec  lcs
  4    0    0    0    2    0    0    0    1 100    0  0 49  0 51 0.00  0.0    1
  4   19    0   40  143    7    7    1    1 100   19 100  0  0  0 0.61 30.7    7
  4    0    0    0  117    2    2    1    1 100    0 100  0  0  0 0.65 32.6    4
  4    0    0    0   99    1    1    1    1 100    0 100  0  0  0 0.65 32.6    3
  4    0    0    0  107    3    3    1    3 100    0 100  0  0  0 0.65 32.6    6
  4    0    0    0  145    5    5    1    3 100    0 100  0  0  0 0.65 32.6    9
  4    0    0    0  113    2    2    1    1 100    0 100  0  0  0 0.65 32.6    3
  4    0    0    0  115    1    1    1    1 100    0 100  0  0  0 0.65 32.6    7
  4    0    0    0  106    1    1    1    1 100    0 100  0  0  0 0.65 32.6    2
  4    0    0    0  113    1    1    1    1 100    0 100  0  0  0 0.65 32.6    5
  4    0    0   41  152    2    2    1    1 100    0 100  0  0  0 0.65 32.6    3
  4    5    0    0    6    0    0    0    1 100    4 100  0  0  0 0.04  1.8    1
Processor 4 is running at 100%. Right away you should realize something is wrong with how we are interpreting the nmon output – because our “stress” process is the only thing running on this processor. The mpstat utility is not using the kernel’s rusage process accounting data and it shows that our process is running on the CPU for the full time.
So… what in the world did IBM do? The answer – which Steve and Marcin published a few years ago – starts with the little mpstat column called “pc”. This stands for “physical consumption”. (It’s called “physc” in sar -P output and in topas/nmon.) This leads us to the heart of IBM’s solution to the system-wide CPU reporting problem.
IBM is thinking about everything in terms of capacity rather than time. The pc number is a fraction that scales down utilization numbers to reflect utilization of the core (physical cpu) rather than the hardware thread (logical cpu). And in doing this, they don’t just divide by four on an SMT-4 chip. The fraction is dynamically computed by the POWER processor hardware in real time and exposed through a new register called PURR. IBM did a lot of testing and then – starting with POWER7 – they built the intelligence in to the POWER processor hardware.
In our example, we are using one SMT hardware thread at 100% in SMT-4 mode. The POWER processor reports through the PURR register that this represents 65% of the processor’s capacity, exposed to us through the pc scale-down factor of 0.65 in mpstat. My POWER7 processor claims it is only 65% busy when one if its four threads is running at 100%.
I also ran the test using two SMT hardware threads at 100% on the same processor in SMT-4 mode. The processor scaled both threads down to 45% so that when you add them together, the processor is claiming that it’s 90% busy – though nmon & topas will show each of the two processes running at only 45% of a CPU! When all four threads are being used at 100% in SMT-4 mode then of course the processor will scale all four processes down to 25% – and the processor will finally show that it is 100% busy.
 On a side note, the %ec column is showing the physical consumption as a percentage of entitled capacity (2 processors). My supposed 65% utilization of a processor equates to 32.6% of my system-wide entitled capacity. Not coincidentally, topas shows the “stress” process running at 32.6% (like I said, solaris-style).
So AIX is factoring in the PURR ratio when it populates the POSIX rusage process accounting structure. What is the benefit? Topas and other monitoring tools calculate system load by adding up the processor and/or process utilization numbers. By changing the meaning from time to capacity at such a low level, it helps us to very easily get an accurate view of total system utilization – taking into account the real life performance characteristics of SMT.
The big win for us is that on AIX, we can use our normal paging thresholds and we have better visibility into how utilized our system is.
The Big Problem With AIX/POWER7/SMT CPU Accounting Changes
But there is also a big problem. Even if it’s not a formal standard, it has been a widely accepted convention for decades that the POSIX rusage process accounting numbers represent time. Even on AIX with POWER7/SMT, the “time” command baked into both ksh and bash still uses the old default output format:
# time ./stress -c 1 -t 66
stress: info: [34537674] dispatching hogs: 1 cpu, 0 io, 0 vm, 0 hdd
stress: info: [34537674] successful run completed in 66s

real    1m6.00s
user    0m41.14s
sys     0m0.00s
It’s obvious from the output here that everybody expects the rusage information to describe time. And the real problem is that many software packages use the rusage information based on this assumption. By changing how resource accounting works, IBM has essentially made itself incompatible with all of that code.
Of course, the specific software that’s most relevant to me is the Oracle database.
I did do a basic truss on a dedicated server process; truss logged a call to appgetrusage() which I couldn’t identify but I think it’s most likely calling getrusage() under the hood.
# truss -p 15728860
kread(0, 0x09001000A035EAC8, 1152921504606799456) (sleeping...)
kread(0, 0x09001000A035EAC8, 1152921504606799456) = 207
kwrite(6, "\n * * *   2 0 1 6 - 0 6".., 29)     = 29
lseek(6, 0, 1)                                  = 100316
...
kwrite(6, " C L O S E   # 4 5 7 3 8".., 59)     = 59
kwrite(6, "\n", 1)                              = 1
appgetrusage(0, 0x0FFFFFFFFFFF89C8)             = 0
kwrite(6, " = = = = = = = = = = = =".., 21)     = 21
kwrite(6, "\n", 1)                              = 1
For what it’s worth, I also checked the /usr/bin/time command on AIX – it is using the times() system call, in the same library as getrusage().
# truss time sleep 5
execve("/usr/bin/time", 0x2FF22C48, 0x200130A8)  argc: 3
sbrk(0x00000000)                                = 0x20001C34
vmgetinfo(0x2FF21E10, 7, 16)                    = 0
...
kwaitpid(0x2FF22B70, -1, 4, 0x00000000, 0x00000000) (sleeping...)
kwaitpid(0x2FF22B70, -1, 4, 0x00000000, 0x00000000) = 26017858
times(0x2FF22B78)                               = 600548912
kwrite(2, "\n", 1)                              = 1
kopen("/usr/lib/nls/msg/en_US/time.cat", O_RDONLY) = 3
Problems For Oracle Databases
The fundamental problem for Oracle databases is that it relies on getrusage() for nearly all of its CPU metrics. DB Time and DB CPU in the AWR report… V$SQLSTATS.CPU_TIME… extended sql trace sql execution statistics… as far as I know, all of these rely on the assumption that the POSIX rusage data represents time – and none of them are aware of the physc scaling factor on AIX/POWER7/SMT.
To quickly give an example, here is what I saw in one extended SQL trace file:
FETCH #4578129832:c=13561,e=37669,p=2,cr=527,...
I can’t list all the WAIT lines from this trace file – but the CPU time reported here is significantly lower than the elapsed time after removing all the wait time from it. Typically this would mean we need to check if the CPU is oversaturated or if there is a bug in Oracle’s code. But I suspect that now Oracle is just passing along the rusage information it received from the AIX kernel, assuming that ru_utime and ru_stime are both representing time.
If you use a profiler for analyzing trace files then you might see something like this:

The key is “unaccounted-for time within dbcalls” – this is what I’ve seen associated with the AIX/Power7/SMT change. It’s worth scrolling down to the next section of this profile too:

There was at least a little unaccounted-for time in every single one of the 81,000 dbcalls and it was the FETCH calls that account for 99% of the missing time. The FETCH calls also account for 99% of the CPU time.
What This Means For You
The problem with this unaccounted-for time on AIX/SMT is that you have far less visibility than usual into what it means. You can rest assured that CPU time will always be under-counted. On AIX/SMT, a percentage of CPU time will always be reported incorrectly as unaccounted-for time – but there’s no way to know how much of the unaccounted-for time was actually CPU. Anywhere from 25% to 75% of the CPU time could be incorrectly rolled into unaccounted-for time. At any point in time each processor and process has a different percentage.
I’ve heard one person say that they always double the CPU numbers in AWR reports for AIX/SMT systems. It’s a stab in the dark but perhaps useful to remember. Also, I’m not sure whether anyone has opened a bug with Oracle yet – but that should get done. If you’re an Oracle customer on AIX then open a ticket and let Oracle know that you need their code to correctly report CPU time on POWER7/SMT!
In the meantime we need to keep doing what we can. The most important point to remember is that when you see unaccounted-for time, some or all of it is normal CPU time which was not correctly accounted. As Karl Arao and others have said: when you’re on AIX/SMT, investigate operating system load/capacity and runqueue health with ONLY the psize, physc and app columns from lparstat (and corresponding values in nmon/topas).
If you’re running Oracle on AIX, I’d love to hear your feedback. Please feel welcome to leave comments on this article and share your thoughts, additions and corrections!


This situation does not seem to have improved with Oracle 12.1.0.2. Just last week I saw large amounts of time appearing as ‘unaccounted for within DB call’ on AIX on Power7.
LikeLike
Posted by jkstill | January 24, 2017, 6:22 pmWe are running Oracle 11.2.0.4 on IAX/POWER. Although all signs pointed to CPU shortage, I couldn’t explain low CPU numbers for the OS in my AWR report.
Jeremy’s article was an eye opener, started me thinking… I needed to explain low CPU utilization at the machine/lpar level. I calculated both core and time based CPU usage and utilization for the whole lpar.
If my calculation is correct, we can “convert” the under-reported time based CPU utilization into core based, that explains my problem of seemingly low CPU utilization while almost maxed out on core.
We can also use the chart to convert core based CPU numbers found in sql trace to time spent on CPU. This allows us to “find” the missing part categorized as “unaccounted-for time”.
To have some faith in my theoretical numbers I also ran some tests, results are pretty close. I would be curious what others think.
LikeLike
Posted by zoltan nyiri | March 8, 2017, 10:21 am