Kubernetes metric container_memory_working_set_bytes is used for evicting/killing pods with too much memory use, especially if memory request < limit (don’t do this with Postgres). The metric is calculated from cgroups v2 memory.stat as current-inactive_file [source].
You’d assume it’s a good metric for memory usage in kubernetes. But with Postgres, this metric is very inaccurate for memory utilization and doesn’t tell you at all if you’re going to OOM crash your database.
After having the same conversation so many times about Postgres on Kubernetes, I need to write it down so I can just send people here to read it.
I will show better metrics to watch.
We start with fundamentals.
Note: scripts to reproduce all tests and graphs are at https://github.com/ardentperf/cgroup-postgres-memtest
Kubernetes Node E2E Tests
This is ground-zero for what Kubernetes promises to be true. AI research is telling me make test-e2e-node has several memory-pressure eviction tests:
- MemoryAllocatableEviction [source]
- MemoryAllocatableEvictionPodLevelResources [source]
- PriorityMemoryEvictionOrdering [source]
- PriorityMemoryEvictionOrderingPodLevelResources [source]
I believe these tests all use a test kit called agnhost [source]. Lets fire it up in docker and grab a few cgroup v2 metrics
docker run --name graph-repro-run_1-1821100 \
    --memory 512m --memory-swap 512m --detach \
    registry.k8s.io/e2e-test-images/agnhost:2.47 \
    stress --mem-alloc-size 25Mi --mem-alloc-sleep 5s --mem-total 1Gi
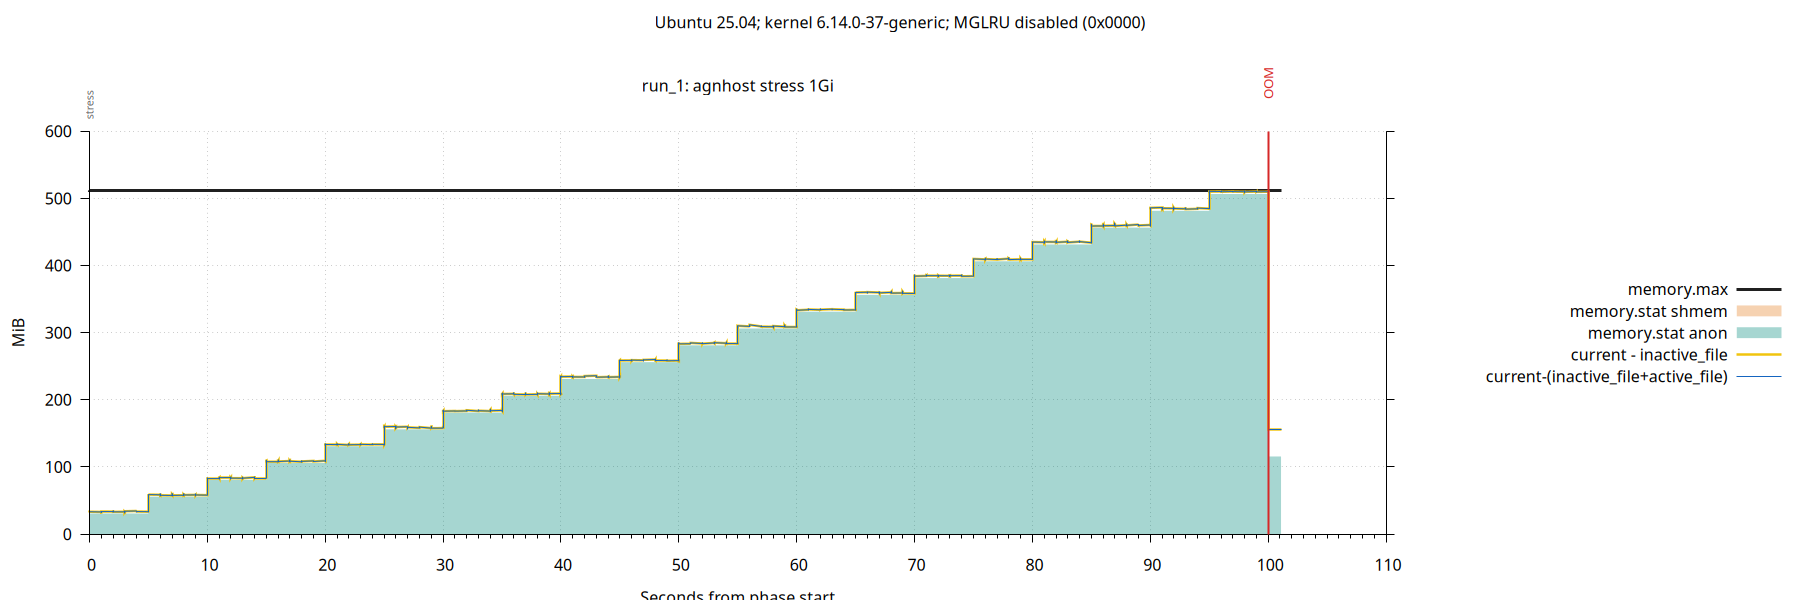
container_memory_working_set_bytes is the yellow line: current-inactive_file. It tells current memory usage, excluding linux page cache contents on the “active” file LRUs. The blue line is my own metric, where I’ve excluded all file LRUs (both active and inactive) – basically I’m saying “memory usage not including the page cache”.
Looking at the graph:
Anonymous memory ramp-up. As expected, OOM when memory usage hits the cgroup max (aka Pod Memory Limit). If you’re taking notes, remember that OOM will be a full database crash and restart for Postgres.
Simple. No shmem in the test, no active page cache in the test.
Postgres Simple Sort (ORDER BY)
Now Postgres.
docker run --name graph-repro-run_2-1821100 \
    --memory 512m --memory-swap 512m --detach \
    --env POSTGRES_PASSWORD=graphrepro \
    postgres:18 \
    -c shared_buffers=128MB
In a loop, let’s run a SQL query that sorts rows in memory. Add a half million rows each time until we OOM.
By default, Postgres limits itself to 4MB of working memory for sorts, and spills to temp files on disk after that. Tell Postgres to use more working memory. (Usually you’d decrease working memory if there are lots of concurrent connections all needing memory…)
SET work_mem = '1GB';
SET max_parallel_workers_per_gather = 0;

SELECT count(*) FROM (
  SELECT md5(n::text) AS sort_key
  FROM generate_series(1, $rows) AS input(n)
  ORDER BY sort_key
) AS sorted_values;
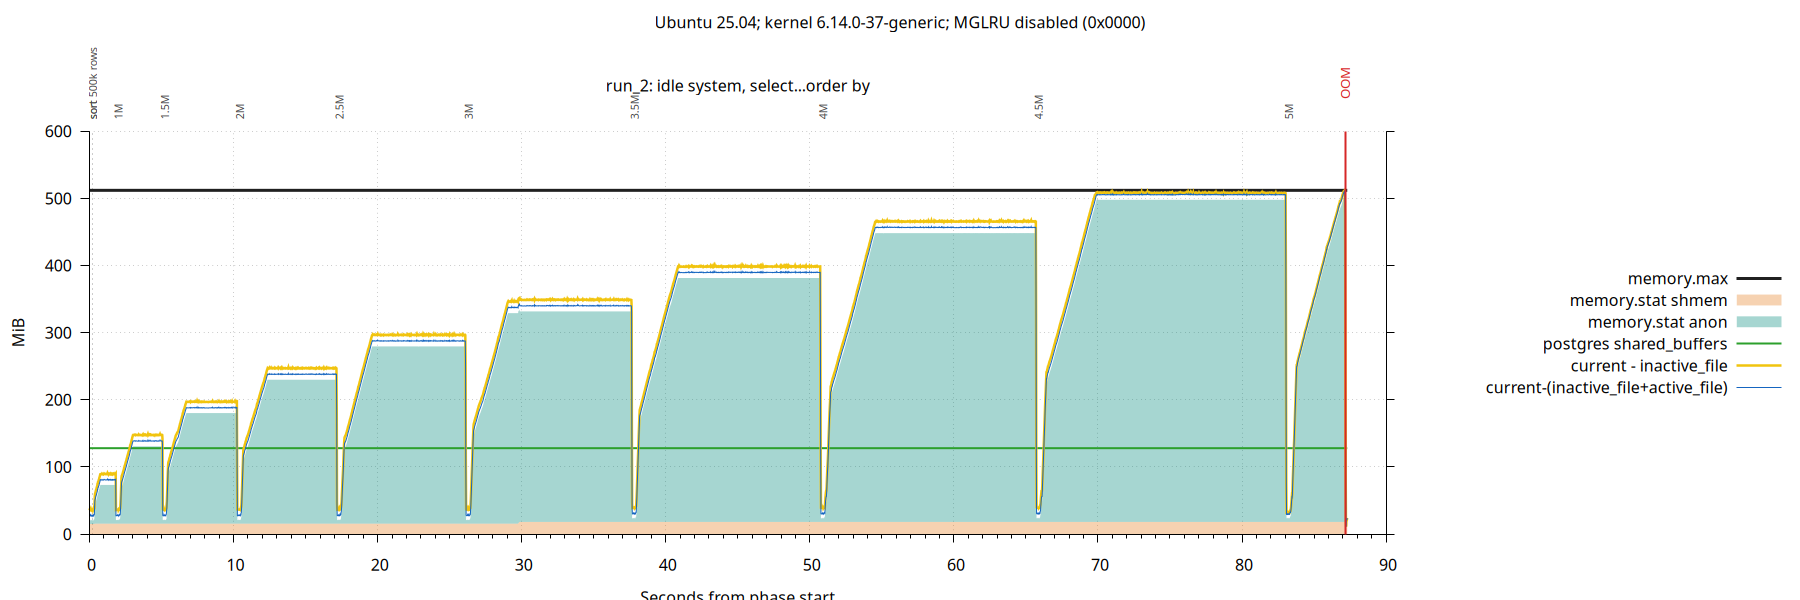
Tracks pretty closely with Kubernetes agnhost. So far, so good. Postgres uses kernel anon memory to perform sorts. It can sort 4.5 million rows, but sorting 5 million rows crashes the database with OOM.
No active page cache.
Postgres Shared Buffers (database cache) are allocated as shmem by the Linux kernel. In this test, Postgres config has 128MB of memory for cache (cf. green line) but the memory has not been allocated by the kernel. This is because we didn’t create any tables.
Postgres with a Small Workload
Enter pgbench – the Postgres hackers best friend. Lets run it in the background while we test ORDER BY statements.
We’ll run the select-only workload and drop the PK from accounts to force full table scans on the accounts table (dropping the PK will also drop the index). We’re going for memory pressure, not TPS.
pgbench --initialize --scale=4

psql -c "ALTER TABLE pgbench_accounts DROP CONSTRAINT pgbench_accounts_pkey"

pgbench --select-only --client=2 --jobs=2
Scale 4 is about 70 MB.

The distance between yellow and blue lines is kernel page cache contents on active file LRUs. We are starting to see a little more.
The linux kernel allocated about half of the Postgres Shared Buffers. They are allocated on demand after startup.
Now the database crashes when sorting only 4M rows (rather than 5M).
We are also starting to see that the page cache has some active pages, not only inactive pages.
This raises a question: are shmem pages reclaimable? What if the database is completely idle and there’s no workload at all – can we release a few of those shared buffer pages to avoid a crash?
Postgres Shared Buffer Cache without any Workload
To answer that question, stop running pgbench and just create a single large table that we can read into the buffer cache before we start running sorts.
CREATE TABLE shared_buffer_filler AS
  SELECT n, repeat(md5(n::text), 8) AS payload
  FROM generate_series(1, 440000) AS input(n);

CREATE EXTENSION pg_prewarm;

SELECT pg_prewarm('shared_buffer_filler'::regclass, 'buffer');
This 440,000 rows table works out to about 127 MB in size. The prewarm extension is a handy way to load a table into your buffer cache. (Postgres uses ring buffers for some bulk ops to avoid one operation evicting everyone else from the cache; I’m using pg_prewarm to explicitly ensure the table is fully loaded to the cache.)
No pgbench – we will simply do this prewarm and then run our sorts.

Now we see the full buffer cache has been allocated. The kernel can never again reclaim shmem – and that means our database will crash when we sort a mere 3.5M rows (rather than 4M).
If you’re running postgres in cgroups with memory.max (aka Kubernetes Memory Limit) then you might want to run with shared_buffers lower than what’s typically recommended.
So far, Kubernetes metric container_memory_working_set_bytes is a good indicator of memory use. Now that we’ve established all of our fundamentals lets look at a more interesting case.
Postgres with a Realistic Workload
After prewarm, start pgbench with scale 20 for 300 MB (after dropping the 50 MB PK index). Repeat the sort test.
pgbench --initialize --scale=20

psql -c "ALTER TABLE pgbench_accounts DROP CONSTRAINT pgbench_accounts_pkey"

pgbench --select-only --client=2 --jobs=2
Now we break Kubernetes. :)

Same database crash on the 3.5M row sort. But now, the kubernetes metric container_memory_working_set_bytes (yellow line) is not giving a useful indicator of memory use.
Directly inspecting cgroup metrics: shmem reflects Postgres Shared Buffers and anon reflects working memory of SQL queries. When these approach the container limit, we get a database crash (OOM).
Postgres with a Smaller Buffer Cache
Lets take a look at what happens if we reduce the size of the buffer cache.
docker run --name graph-repro-run_2-1821100 \
    --memory 512m --memory-swap 512m --detach \
    --env POSTGRES_PASSWORD=graphrepro \
    postgres:18 \
    -c shared_buffers=32MB
Run exactly the same test.

Kubernetes container_memory_working_set_bytes is actively misleading. The system looks like it has more memory pressure, but really it has less. Now we can sort 4M records without crashing (instead of 3M).
Active pages in the linux page cache are easily reclaimed under memory pressure. If we want a reliable metric, the simplest and best route is to ignore the page cache entirely (blue line), rather than only ignoring inactive pages (yellow line).
When I find a few more minutes, I’ll show how to add this corrected memory utilization metric with CloudNativePG. Basically, you simply add the pgnodemx extension (https://github.com/pgnodemx/pgnodemx/) then write a CNPG custom monitoring query that does the correct calculation from the cgroup metrics. I’ll also try to find time to run everything against a full kubernetes environment in a production configuration – confirming the patterns hold.
Appendix: MGLRU
Linux’s new Multi-Gen LRU changes everything. It seems to be enabled by default on the latest Debian and Ubuntu LTS releases. I’m not sure if people are enabling it in Kubernetes systems yet.
Here are the last two tests repeated with MGLRU enabled:


With MGLRU, Linux represents the two youngest generations as “active” and my system had min_gen=2 and max_gen=4. Linux seemed much less prone to have pages on “active” generations in these tests running on my laptop, but I haven’t spent enough time with MGLRU to know what workloads would make more pages appear as active to Kubernetes.
Memory pressure is a complex topic, especially once swap enters the picture. I think swap remains disabled on many Kubernetes systems, but this might change. PSI is also an important metric for linux memory pressure. This blog is more focused on utilization than pressure.
In Summary: current - (inactive_file+active_file) remains a very useful metric, and I think it should always be collected for Postgres when it’s running on Kubernetes. I would also collect shmem and anon, and maybe samples of top-N resident - shared from /proc/pid/statm which seems cheaper for frequent collection across a large number of processes than RssAnon from /proc/pid/Status.






Discussion
Trackbacks/Pingbacks
Pingback: Postgres vs Kubernetes container_memory_working_set_bytes – Curated SQL - August 19, 2026